D3鼠标事件 + Tooltip 展示公路网信息
分类:javascript
今天捣鼓了一下D3的鼠标事件,做了一个小功能。
展示如下:

废话不多说,上步骤!
数据预处理:
先看看数据的结构:

可以看到,数据本身就包含了名字,ID等信息,我们就依据这个数据集来显示每条道路的名字。
设置一个ToolTip
设置tooltip的格式
    <style type="text/css">
  		.tooltip{
  			font-family:simsun;
  			font-size:8px;
  			width:120px;
  			height:80px;
  			position:absolute;
  			text-align:center;

  			border-style:solid;
  			border-width:0px;
  			color:#ff0000;
  			background-color:#cccccc;
  			/***border-radius:5px;***/
  		}

  </style>
使用D3.js创建一个ToolTip
var tooltip = d3.select("body").append("div")
		.attr("class","tooltip") //用于css设置类样式
		.attr("opacity",0.0); //设置为不可见
设置画布并绘制路网图:
这里同时加载完了路网的基础数据
<svg class ="changsha"></svg>
<script>
  //SVG大小设置
    const svgWidth = 1380;
    const svgHeight =900;
    const padding = 0;

    const svg = d3.select(".changsha")
        .attr("height", svgHeight)
        .attr("width", svgWidth);
<svg class ="changsha"></svg>
	<script>
    const svgWidth = 1380;
    const svgHeight =900;
    const padding = 0;
    //基于数据设置画布中心,这里changsha就是对象化了的数据
    const svg = d3.select(".changsha")
        .attr("height", svgHeight)
        .attr("width", svgWidth);

		/*
		 * 创建一个地理投影
		 * .center 设置投影中心位置
		 * .scale 设置缩放系数
		 */
	const x0 = padding;
	const y0 = padding;
	const x1 = svgWidth - padding * 2;
	const y1 = svgHeight - padding * 2;
	const projection = d3.geoMercator().fitExtent(
			[
				[x0,y0],
				[x1,y1],
			],changsha
		 );
		//如果采用手动设定中心,可以稍稍加快运算速度
		// 创建路径生成器path
		var path = d3.geoPath().projection(projection);

		/*
		 * 渲染地图
		 */
	const mapPath = svg.selectAll("path");
		  mapPath.data(changsha.features)
			.join('path')
			.attr('d', path)
			.attr("stroke-width", 2)
			.attr("stroke", "#00cc00")
			.attr("fill", "#000000")
		/*
		 * 创建一个地理投影
		 * .center 设置投影中心位置
		 * .scale 设置缩放系数
		 */
	const x0 = padding;
	const y0 = padding;
	const x1 = svgWidth - padding * 2;
	const y1 = svgHeight - padding * 2;
	const projection = d3.geoMercator().fitExtent(
			[
				[x0,y0],
				[x1,y1],
			],changsha
		 );
		//中心对齐可以再修改一下
		//  创建路径生成器path
		var path = d3.geoPath().projection(projection);

		/*
		 * 渲染地图
		 */
	const mapPath = svg.selectAll("path");
		  mapPath.data(changsha.features)
			.join('path')
			.attr('d', path)
			.attr("stroke-width", 2)
			.attr("stroke", "#00cc00")
			.attr("fill", "#000000")
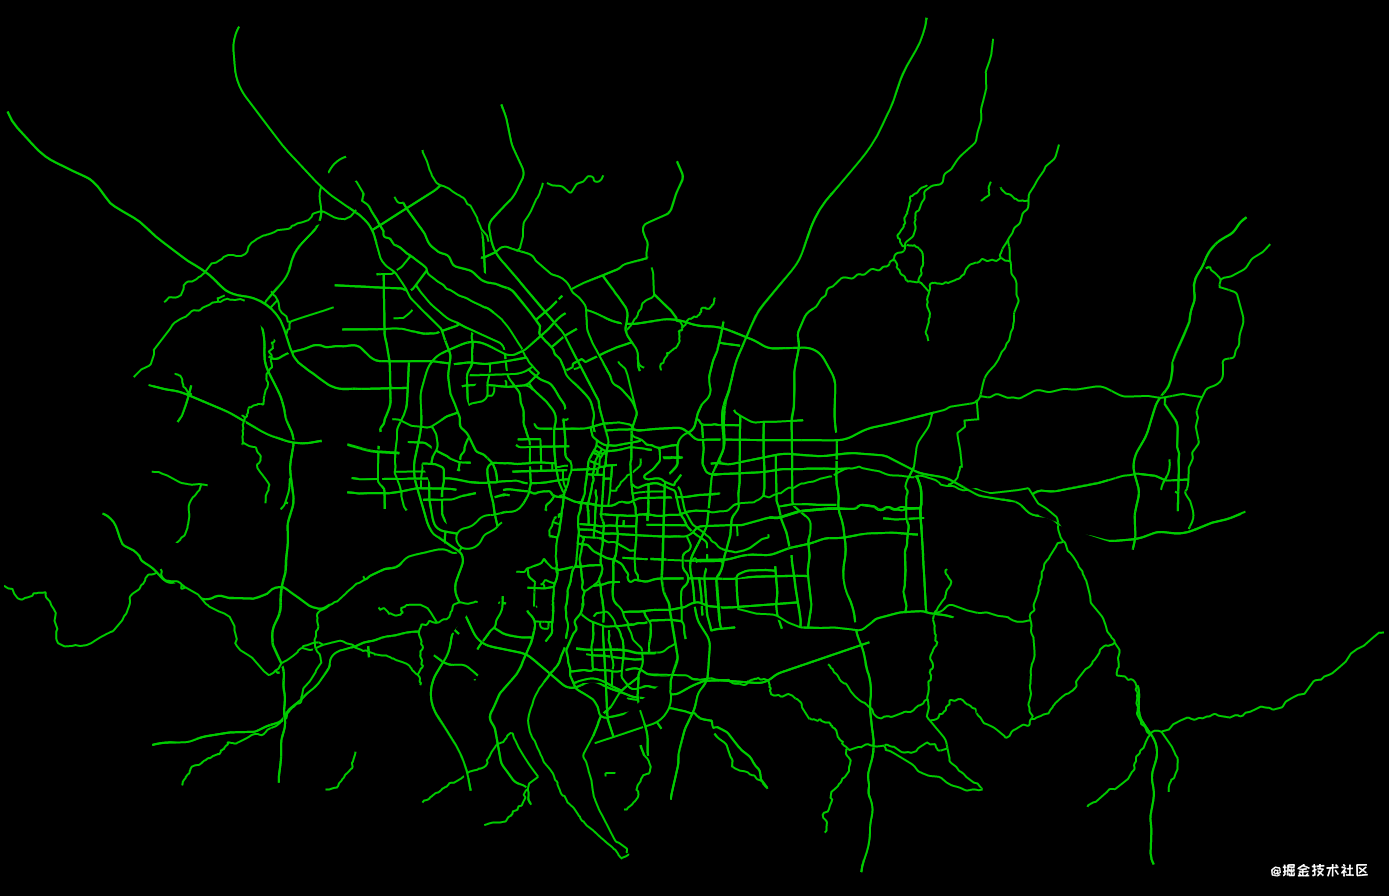
绘制结果:
STOMP传送数据分析:
利用stomp-websocket运行服务器向客户端实时发送数据,详细实现请参照:道路实时变色
这里我服务器传送的数据结构是这样的:
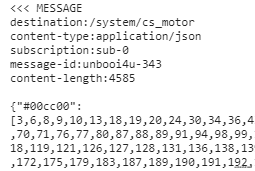
也就是一次传送一种颜色(图中:"#00cc00"),后面跟的数组就是随机的升序数组。根据这个数组改变对应次序的path标签的颜色。
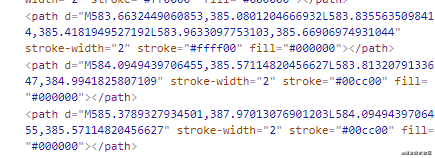
可以看到对应次序的path标签stroke的值已经改变了.
鼠标移入移出事件
总算到核心代码了,感觉自己好啰嗦啊哈哈哈
值得一提的是,version 6 以上的D3.JS已经移除了d3.event和与之相关的函数,想要通过D3获取鼠标位置,取而代之的方法是d3.pointer。详细见代码。
另外,我的function(d,i)写法也有问题,最新的版本应该理解为的function(event,d) 也就是说:第一个参数为事件,第二个为对应数据。 详见官方文档
//移入事件
svg.selectAll('path')
.on("mouseover",function (d,i) {
//获取当前鼠标指向的path标签的数据(名字和id)
var name = i.properties.name;
var osm_id = i.properties.osm_id;
//这里获取鼠标坐标
var p = d3.pointer(d);
//获取这个path标签的stroke属性
var color = d3.select(this).attr("stroke")
tooltip
//显示文本
.html(function(){
var road;
var status;
//由于部分数据name部分残缺,在这里处理一下
if(name == null){
road = ["暂无信息"];
}
else{
road = [""+name];
}
//根据这个path标签的颜色设置信息
switch (color){
case '#00cc00': status = "正常";break;
case '#ffff00': status = "车流量大";break;
case '#ff0000': status = "堵塞";break;
default : status = "正常";
}
//这里还没处理好,要做到两行分布
return road +"
"+"
"+status
})
//设置显示位置
.style("left",(p[0] +35)+"px")
//要注意顶部距离,如果遮盖住了鼠标就会导致无法选中路径,此处设置了正右侧显示
.style("top", (p[1] )+"px")
//设置为可见
.style("opacity",1.0);
})
//设置移出事件
.on("mouseout",function (d,i) {
//直接设置不可见就行啦!
tooltip.style("opacity",0.0);
});
完毕!再来用一个GIF来结束吧!