😊不多逼逼,拒绝废话,直接上代码!
1.支持自动重新set数据,减少非必要的心智负担
2.支持响应式的容器大小改变,自动获取父容器高度
3.可以通过组件对象获取原生api扩展支持
4.支持地图的生成配置及下沉功能
5.自动监听组件的图列点击行为,并通过自定义事件触发
<template>
<div ref="echartsRef" :style="echartsSize"/>
</template>
<script setup lang="ts" name="Echarts">
/**
* @Description:echarts组件封装
* @author 莫若省
* @mail 14462213@qq.com
* @date 2023/12/29
*/
import type {EChartsType} from "echarts"
import { GeoJSONSourceInput } from 'echarts/types/src/coord/geo/geoTypes';
import * as echarts from 'echarts';
import {onBeforeUnmount, onMounted, reactive, ref, watch} from "vue";
//引入节流函数
import throttle from 'lodash/throttle';
const props = defineProps({
// 配置项
options: {
type: Object,
default: () => < Record<string, any>>({}),
},
// 容器宽高
width:{
type:  Number,
default:0
},
// 容器宽高
height:{
type:  Number,
default:0
},
//地图名称
mapName:{
type:  String,
default:''
},
//地图数据
mapData: {
type: Object,
default: () => <GeoJSONSourceInput>({})
},
//是否开启点击事件监听(如果需要自行通过ref获取echarts实例监听事件设置为false)
openClickEvent:{
type:  Boolean,
default:true
}
})
const emit = defineEmits(['clickEvent'])
// 定义一个ref类型的变量,用于获取DOM元素作为基础容器
const echartsRef = ref<HTMLElement>();
//定义全局的echarts实例
let echartsInstance: EChartsType | null | undefined;
//监视器对象
let obServer: ResizeObserver | null
//当前echarts实例的宽高
const echartsSize = reactive({
width:props.width + 'px',
height:props.height + 'px'
})
//设置当前echarts宽高的功能函数
const setEchartsSize = ()=>{
const width =  props.width || echartsRef.value?.parentElement?.offsetWidth
const height =  props.height || echartsRef.value?.parentElement?.offsetHeight || 0
//如果未能获取高度抛出错误
if(echartsInstance && !height){
console.error('Did not get the container height, tried to set the container height to 100%, please check the container height is correct!')
}
echartsSize.width = width + 'px'
echartsSize.height = height ? height + 'px' : '100%'
return {
width:echartsSize.width,
height:echartsSize.height
}
}
/**
* @Description: echarts初始化函数
* @author 莫若省
* @mail 14462213@qq.com
* @date 2023/12/29
*/
const echartsInit = (echartsContainerDom:HTMLElement)=>{
// 设置echarts实例宽高
const domSize = setEchartsSize()
echartsContainerDom.style.width = domSize.width
echartsContainerDom.style.height = domSize.height
//地图配置初始化(需要传入mapName和mapData)
props.mapName && echarts.registerMap(props.mapName, props.mapData as GeoJSONSourceInput);
// 基于准备好的dom,初始化echarts实例,如果已经实例化过了就用之前的(单列模式)。
const echart = echartsInstance ? echartsInstance : echarts.init(echartsContainerDom);
// 设置配置项
echart.setOption(props.options)
//监听点击事件
props.openClickEvent && echart.on('click',(params)=>{
emit('clickEvent',params)
})
//将组件实例返回
return echart
}
/**
* @Description: echarts重新设置配置项的功能函数
* @author 莫若省
* @mail 14462213@qq.com
* @date 2023/12/29
*/
const echartsResetOptions = (newOptions: Record<string, any>)=>(echartsInstance as EChartsType).setOption(newOptions)
/**
* @Description: echarts监听容器或视口发生改变的功能函数
* @author 莫若省
* @mail 14462213@qq.com
* @date 2023/12/29
*/
const echartsResize = ()=>{
//重新渲染echarts尺寸的功能函数
const resizeHandel =()=> {
(echartsInstance as EChartsType).resize()
setEchartsSize()
}
//监听全局的window对象,当window发生尺寸发生改变时,重新渲染echarts实例
window.addEventListener('resize',throttle(resizeHandel,1000))
//如果支持ResizeObserver并且当前echarts实例的父元素存在,那么及监听父容器发生改变时重新渲染echarts实例
if(ResizeObserver && echartsRef.value!.parentElement) {
obServer = new ResizeObserver(throttle(() => {
resizeHandel()
}, 1000))
//放入监听对象
obServer.observe(echartsRef.value!.parentElement as HTMLElement)
}
if(!ResizeObserver) console.warn('The current browser does not support ResizeObserver and will not be able to listen for independent changes to the outer container!')
}
/**
* @Description: 获取当前echarts实例的功能函数
* @author 莫若省
* @mail 14462213@qq.com
* @date 2023/12/29
*/
const  getEchartsInstance = ()=>echartsInstance
onMounted(()=>{
// 初始化echarts,生成实例对象
echartsInstance = echartsInit(echartsRef.value! as HTMLElement)
//开启容器尺寸响应式监测
echartsResize()
})
onBeforeUnmount(()=>{
//销毁echarts实例对象
echartsInstance?.dispose()
echartsInstance = null
//移除监听事件
window.removeEventListener('resize',echartsResize)
//销毁ResizeObserver实例对象
obServer?.disconnect()
obServer = null
})
//监听props的改变
watch(()=>props,()=>{
if(!echartsInstance){
console.error('The current component has not been initialized')
return}
//进行数据重制
echartsInit(echartsRef.value! as HTMLElement)
},{
//开启深度监听
deep:true,
})
defineExpose({
// 重新生成配置项的功能函数
echartsResetOptions,
// 获取当前echarts实例的功能函数
getEchartsInstance,
})
</script>
<style scoped lang="scss">
</style>
组件内使用了lodash
大佬可以自行封个节流函数处理,小白可以通过npm/pnpm安装
pnpm i lodash
属性
| Props | 类型 | 默认值 | 必填 |
|---|---|---|---|
| options | object | {}/配置项 | true |
| width | number | 0/父容器宽/100% | false |
| height | number | 0/父容器高/100% | false |
| mapName | string | “”/(需要使用地图时传入即可) | false |
| mapData | object | {}/地图信息对象 | false |
| openClickEvent | boolean | true/(设置为true时,在挂着完毕后自动监听echarts点击事件,可通过自定义事件‘clickEvent’触发) | false |
自定义事件
| Event | 行参 | 触发时机 |
|---|---|---|
| @clickEvent | eventPrams(Echarts的点击事件参数) | 当图列被点击时 |
组件实例方法
| FnName | 实参 | 返回值 |
|---|---|---|
| getEchartsInstance | null | echarts实例对象 |
| echartsResetOptions | echarts配置对象 | undefined |
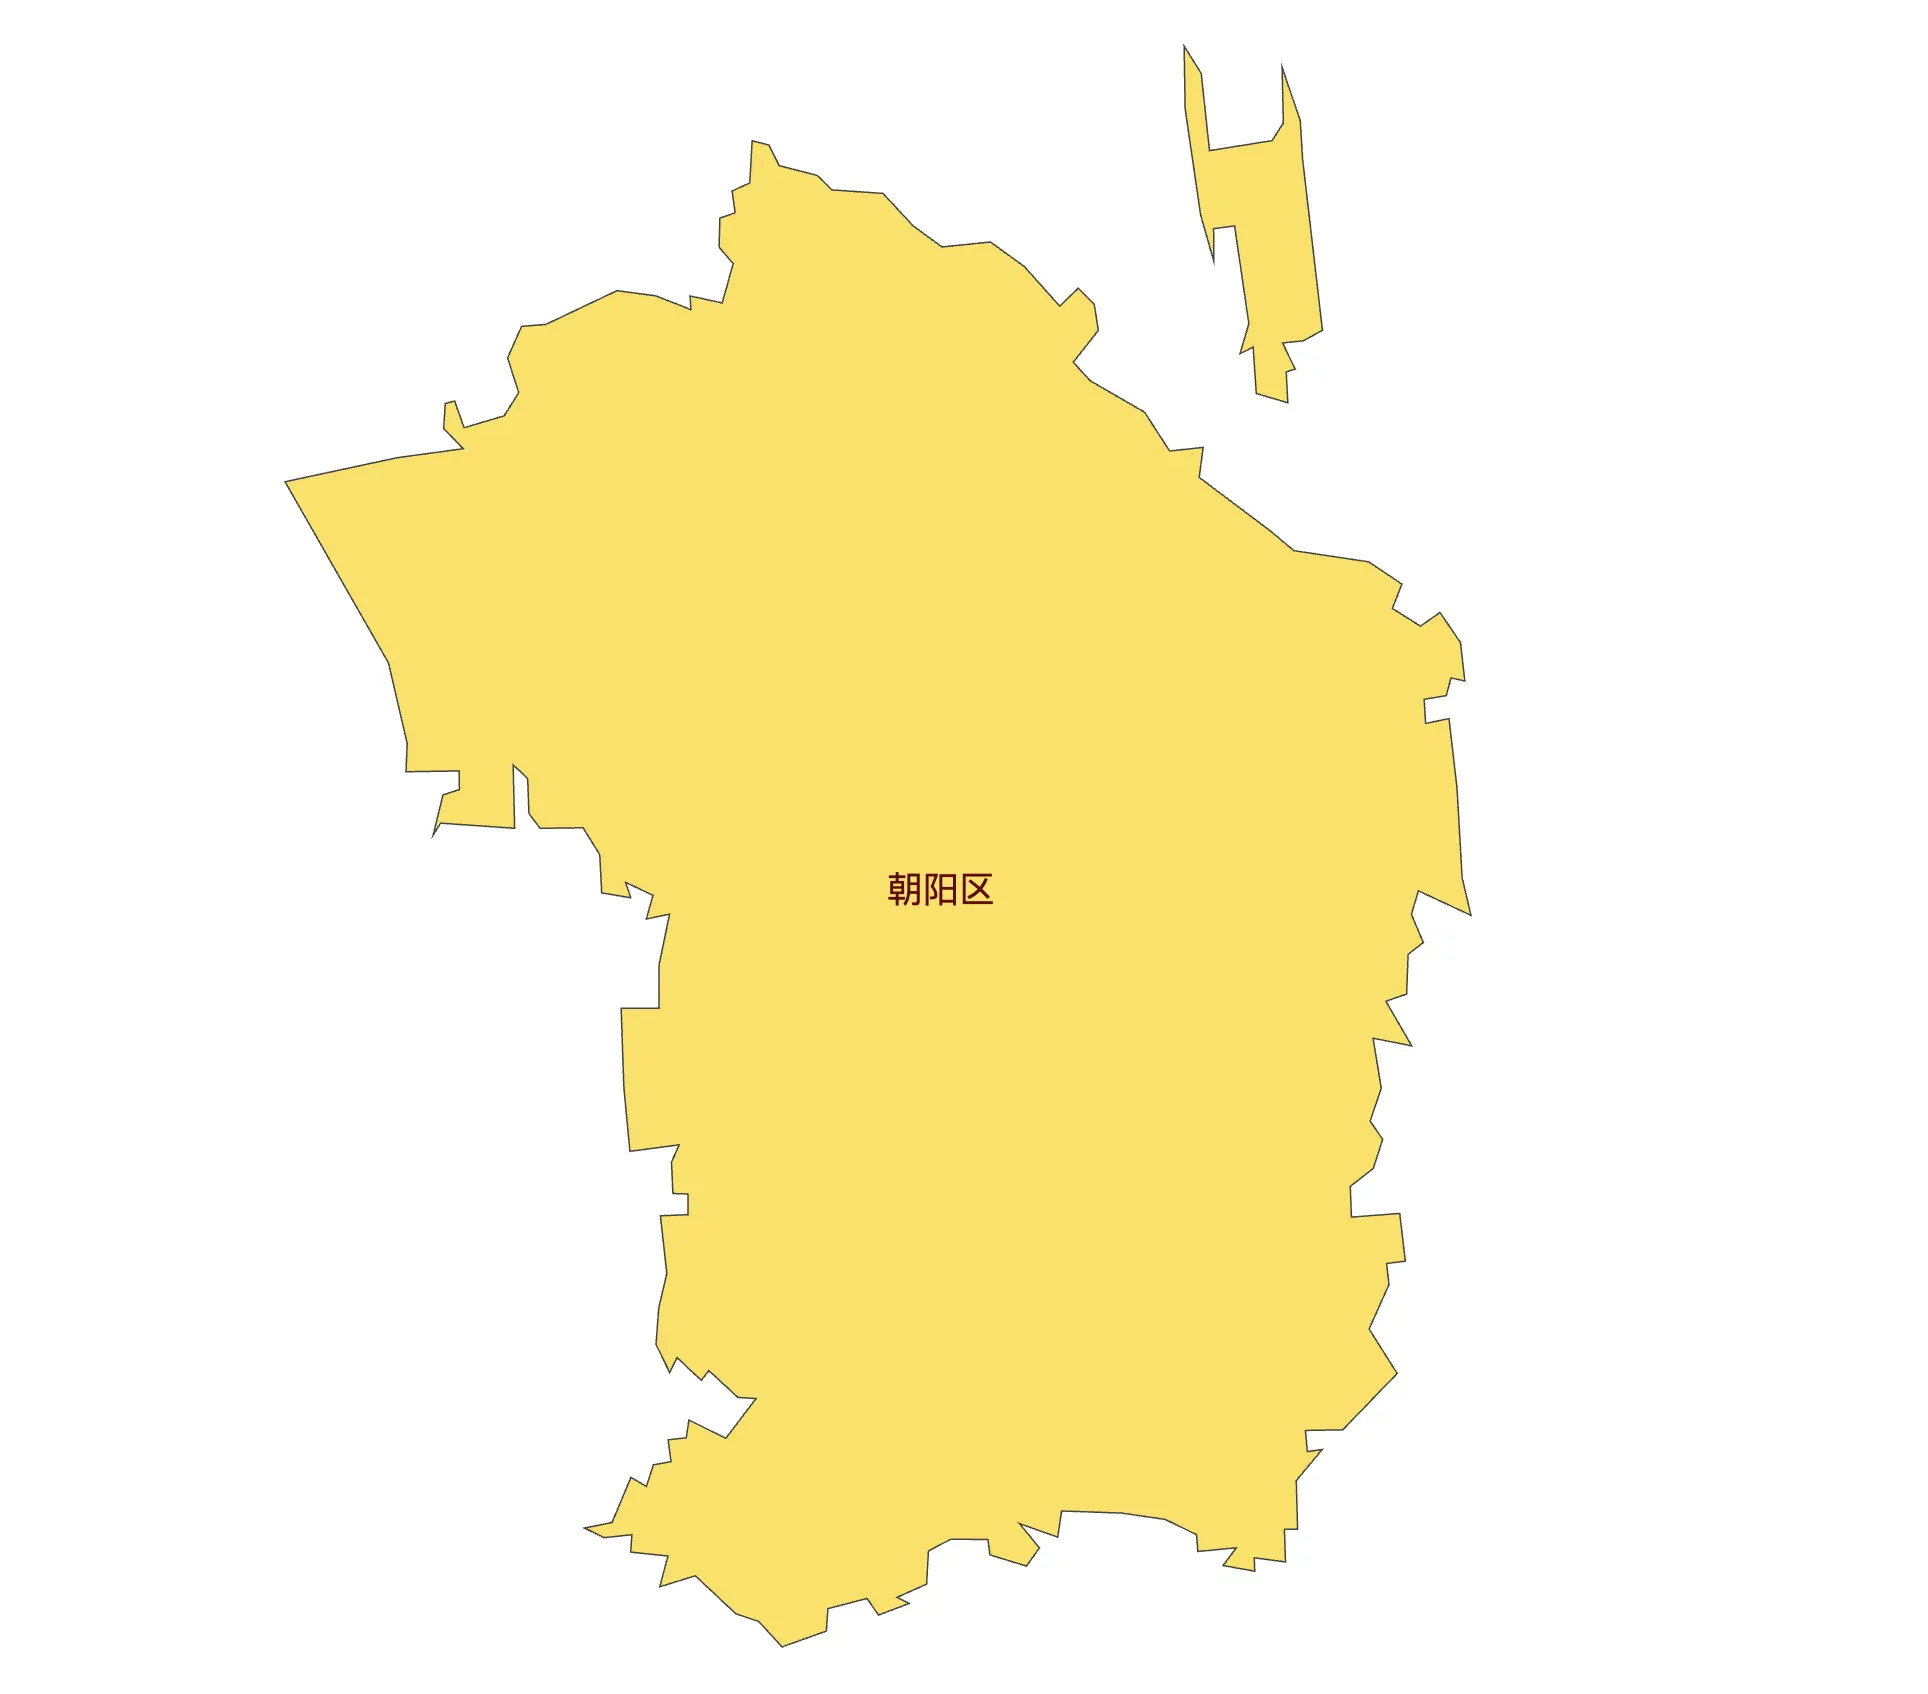
使用Demo,简单实现地图点击板块自动下沉功能
<template>
<div class="app">
<ECharts :options="options" map-name="beijing" :map-data="mapData" @click-event="clickEvent"/>
</div>
</template>
<script setup lang="ts">
import ECharts from "./components/Echarts/index.vue"
import {reactive, ref} from "vue";
import beijingMap from "./components/Echarts/map/beijing.json"
const mapData = ref(beijingMap)
const options = reactive({
series: [{
type: 'map',
map: 'beijing',
}]
})
const clickEvent = (params: any)=> {
//获取新的地图信息
mapData.value.features = mapData.value.features.filter(item => item.properties.name === params.name)
}
</script>
<style lang="scss" scoped>
.app {
width: 100%;
height: 100vh;
}
</style>

原文链接:https://juejin.cn/post/7318341249811005440 作者:莫若省