需求
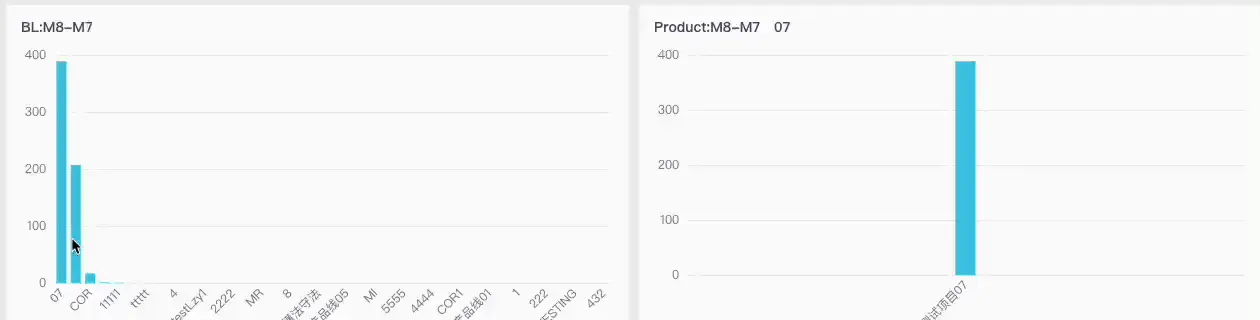
- 两个柱状图联动
- 点击一个柱状图,另一个柱状图的数据更新,并重新渲染
实现效果

代码
封装 mixins(useChart.js)
import * as echarts from 'echarts'
import merge from 'lodash.merge'
import ElementResizeDetectorMaker from 'element-resize-detector'
const erd = ElementResizeDetectorMaker()
export default {
data: () => ({
chartInstance: null,
common: {
color: [
'rgba(58,203,233,1)',
'rgba(255,144,96,1)',
'rgba(244,196,39,1)',
'rgba(122,64,242,1)',
'#3ba272',
'#73c0de',
'#fc8452',
'#9a60b4',
'#ea7ccc'
],
title: {
top: 10,
left: 10,
textStyle: {
fontSize: 14,
lineHeight: 14,
color: '#50506d',
fontWeight: 'normal'
}
},
legend: {
top: 10
},
grid: { left: '3%', bottom: 10, top: 40, right: '3%', containLabel: true },
xAxis: {
// boundaryGap: false,
axisLabel: {
color: '#7a7b91',
fontSize: 12,
interval: 'auto'
},
axisTick: {
show: false,
lineStyle: {
// color:
}
},
axisLine: {
show: false,
lineStyle: {
color: '#d8d8d8'
}
},
splitLine: {
show: true,
lineStyle: {
color: '#EEE8E8',
type: 'dashed'
}
}
},
yAxis: {
axisLabel: {
color: '#7a7b91',
fontSize: 12
},
axisTick: {
show: false,
lineStyle: {
// color:
}
},
axisLine: {
show: false,
lineStyle: {
color: '#d8d8d8'
}
},
splitLine: {
show: false,
lineStyle: {
color: '#EEE8E8',
type: 'dashed'
}
}
},
tooltip: {
trigger: 'axis',
axisPointer: {
type: 'shadow'
}
}
},
option: {},
domHeight: 0,
domWidth: 0
}),
methods: {
initCharts(theme = 'default') {
if (!this.$el) return
this.chartInstance = echarts.init(this.$el, theme)
erd.listenTo(this.$el, element => {
this.domHeight = element.offsetHeight
this.domWidth = element.offsetWidth
this.resize()
})
},
setOptions(options, clear = true) {
this.option = merge({}, this.common, options)
return new Promise(resolve => {
if (this.$el?.offsetHeight === 0) {
setTimeout(() => {
this.setOptions(this.option)
resolve(null)
}, 30)
}
this.$nextTick(() => {
setTimeout(() => {
if (!this.chartInstance) return
clear && this.chartInstance?.clear()
this.chartInstance?.setOption(this.option)
resolve(null)
}, 30)
})
})
},
resize() {
this.chartInstance?.resize({
animation: {
duration: 300,
easing: 'quadraticIn'
}
})
},
getInstance() {
return this.chartInstance
},
getOptions() {
return this.options
}
},
beforeDestroy() {
if (!this.chartInstance) return
erd.uninstall(this.$el)
this.chartInstance?.dispose()
this.chartInstance = null
}
}
index.vue
<template>
<el-row>
<el-col :xs="24" :sm="24" :md="24" :lg="12" class="char">
<LeftBar :source="leftBarData" v-bind="$attrs" @clickBar="handleClickBar" />
</el-col>
<el-col :xs="24" :sm="24" :md="24" :lg="12" class="char">
<RightBar :source="rightBarData" v-bind="$attrs" :current-bl="currentBl" />
</el-col>
</el-row>
</template>
<script>
import LeftBar from './leftBar.vue'
import RightBar from './rightBar.vue'
import { getLeftBarData, getRightBarData } from '@/api/modules/report/schedule'
export default {
name: 'ChartRow',
components: {
LeftBar,
RightBar
},
props: {
params: {
type: Object,
required: true
},
type: {
type: Number,
required: true
}
},
data: () => ({
leftBarData: {
labels: [],
seriesData: {}
},
originSource: [],
asyncSource: [],
currentBl: ''
}),
computed: {
rightBarData() {
const data = this.currentBl
? this.asyncSource.filter(v => v.bl === this.currentBl)
: this.asyncSource
const labels = data.map(v => v.label)
const { recentYears, fiscalYear } = this.params
const seriesData = {}
for (let index = 0; index < recentYears; index++) {
seriesData[fiscalYear - index] = data.map(v => v[`value${index || ''}`])
}
return {
labels,
seriesData
}
}
},
watch: {
params: {
handler(data) {
this.getOverall(data)
this.getRightBar(data)
},
deep: true
}
},
methods: {
async getOverall(params) {
// 更新 top 数据
const data =
(await getLeftBarData({
...params,
type: this.type
})) || []
const labels = data.map(v => v.label)
const { recentYears, fiscalYear } = this.params
const seriesData = {}
for (let index = 0; index < recentYears; index++) {
seriesData[fiscalYear - index] = data.map(v => v[`value${index || ''}`])
}
this.leftBarData = {
labels,
seriesData
}
this.currentBl = labels[0]
},
async getRightBar(params) {
this.originSource =
(await getRightBarData({
...params,
type: this.type
})) || []
this.asyncSource = JSON.parse(JSON.stringify(this.originSource))
},
handleClickBar(index) {
const label = this.leftBarData.labels[index]
this.currentBl = label
}
}
}
</script>
<style lang="scss" scoped>
.char {
height: calc((100vh - 220px) / 2);
min-height: 350px;
max-height: 600px;
padding: 5px;
& > div {
background-color: #fff;
}
}
</style>
leftBar.vue
<template>
<div class="chart" style="width: 100%; height: 100%"></div>
</template>
<script>
import useChart from '@/mixins/useChart'
export default {
name: 'ChartRowLeftBar',
mixins: [useChart],
props: {
source: {
type: Object,
default: () => {}
},
label: {
type: String,
required: true
}
},
computed: {
options() {
return {
title: {
text: `BL:${this.label || ''}`,
textStyle: {
width: this.domWidth,
fontWeight: 'bold',
overflow: 'truncate'
}
},
legend: {
show: false
},
yAxis: {
type: 'value',
splitLine: {
show: true,
lineStyle: {
color: '#EEE8E8',
type: 'dashed'
}
}
},
grid: {
top: 50
},
xAxis: {
type: 'category',
splitLine: {
show: false
},
axisLabel: {
color: '#7a7b91',
fontSize: 12,
interval: 'auto',
rotate: 45
},
axisLine: {
show: false
},
axisTick: {
show: false
},
data: this.source.labels || []
},
series: Object.keys(this.source.seriesData).map(key => ({
name: key,
type: 'bar',
barMaxWidth: 20,
// itemStyle: {
// color: params => {
// const isSelected = !!this.source[params.dataIndex].selected
// return isSelected ? 'rgba(255,144,96,1)' : 'rgba(58,203,233,1)'
// }
// },
data: this.source.seriesData[key] || []
}))
}
}
},
watch: {
source: {
handler() {
this.setOptions(this.options)
},
deep: true
},
domWidth() {
this.setOptions(this.options, false)
}
},
mounted() {
this.initCharts()
this.setOptions(this.options)
this.bindEvent()
},
methods: {
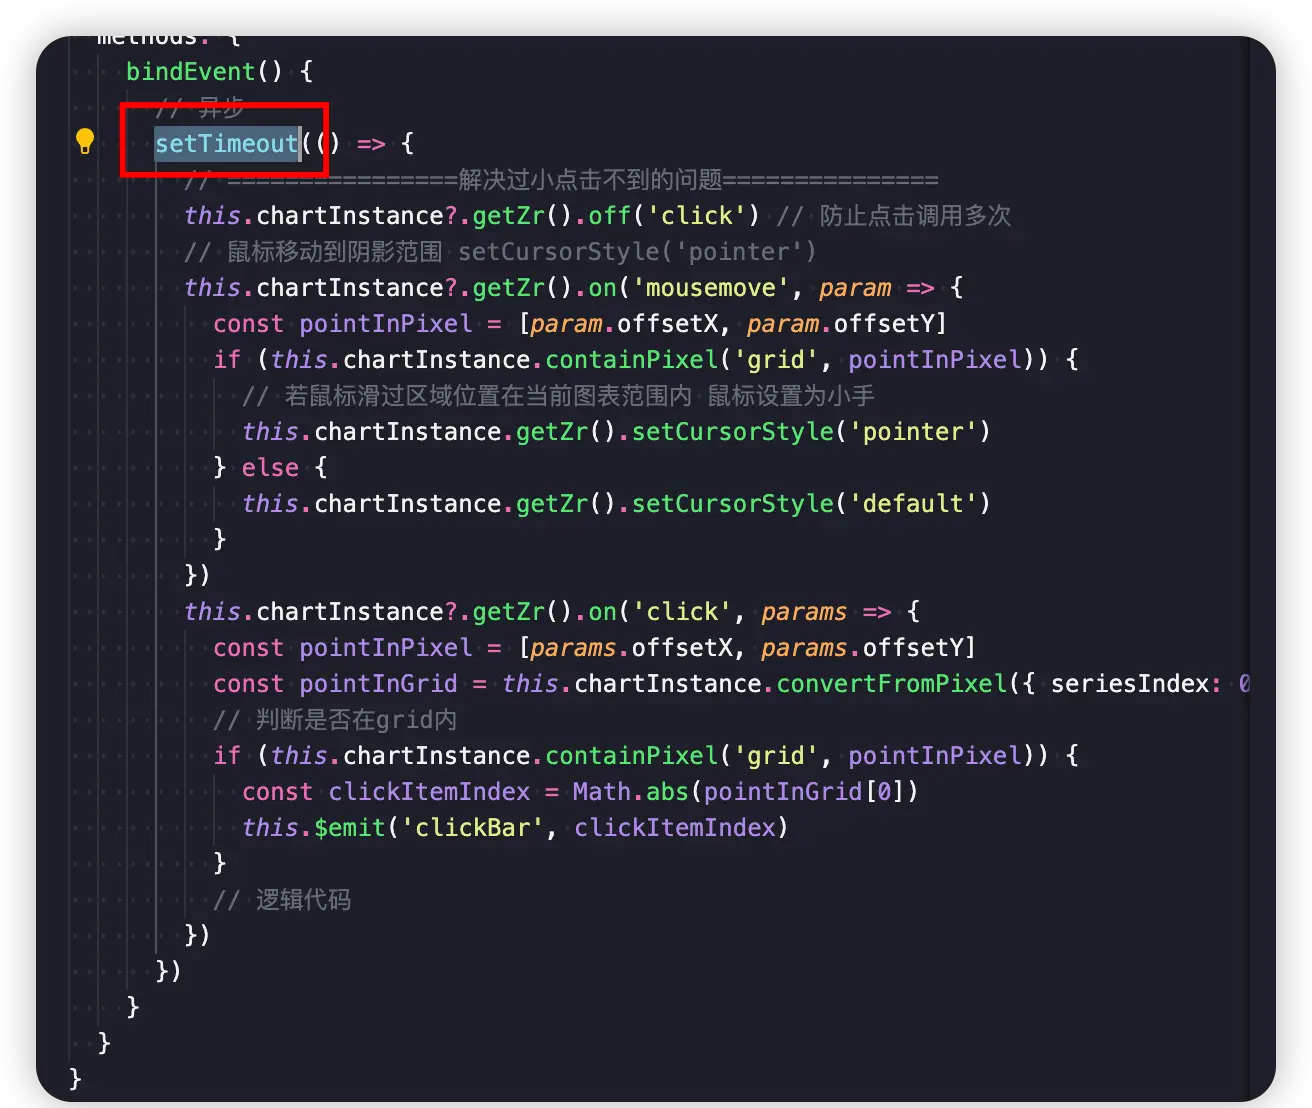
bindEvent() {
// 异步
this.$nextTick(() => {
// ================解决过小点击不到的问题===============
this.chartInstance?.getZr().off('click') // 防止点击调用多次
// 鼠标移动到阴影范围 setCursorStyle('pointer')
this.chartInstance?.getZr().on('mousemove', param => {
const pointInPixel = [param.offsetX, param.offsetY]
if (this.chartInstance.containPixel('grid', pointInPixel)) {
// 若鼠标滑过区域位置在当前图表范围内 鼠标设置为小手
this.chartInstance.getZr().setCursorStyle('pointer')
} else {
this.chartInstance.getZr().setCursorStyle('default')
}
})
this.chartInstance?.getZr().on('click', params => {
const pointInPixel = [params.offsetX, params.offsetY]
const pointInGrid = this.chartInstance.convertFromPixel({ seriesIndex: 0 }, pointInPixel)
// 判断是否在grid内
if (this.chartInstance.containPixel('grid', pointInPixel)) {
const clickItemIndex = Math.abs(pointInGrid[0])
this.$emit('clickBar', clickItemIndex)
}
// 逻辑代码
})
})
}
}
}
</script>
rightBar.vue
<template>
<div class="chart" style="width: 100%; height: 100%"></div>
</template>
<script>
import useChart from '@/mixins/useChart'
export default {
name: 'ChartRowRightBar',
mixins: [useChart],
props: {
source: {
type: Object,
default: () => {}
},
label: {
type: String,
default: ''
},
currentBl: {
type: String,
default: ''
}
},
computed: {
options() {
return {
title: {
text: `Product:${this.label || ''}   ${this.currentBl}`,
textStyle: {
width: this.domWidth,
fontWeight: 'bold',
overflow: 'truncate'
}
},
legend: {
show: false
},
yAxis: {
type: 'value',
splitLine: {
show: true,
lineStyle: {
color: '#EEE8E8',
type: 'dashed'
}
}
},
grid: {
top: 50
},
xAxis: {
type: 'category',
splitLine: {
show: false
},
axisLabel: {
color: '#7a7b91',
fontSize: 12,
interval: 'auto',
rotate: 45
},
axisLine: {
show: false
},
axisTick: {
show: false
},
data: this.source.labels || []
},
series: Object.keys(this.source.seriesData).map(key => ({
name: key,
type: 'bar',
barMaxWidth: 20,
data: this.source.seriesData[key] || []
}))
}
}
},
watch: {
source: {
handler() {
this.setOptions(this.options)
},
deep: true
},
domWidth() {
this.setOptions(this.options, false)
}
},
mounted() {
this.initCharts()
this.setOptions(this.options)
}
}
</script>
bug
刷新页面的时候,控制台会报错,偶现
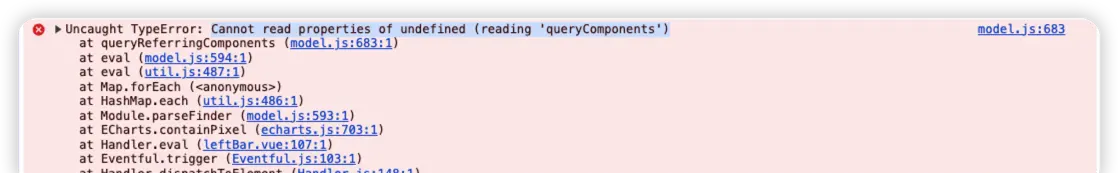
解决
- 经查为手动绑定事件的时候,异步执行时机的问题
- this.$nextTick 偶现执行超前于 chart.setOptions()
- 改为 setTimeout 因为 setTimeout 方法在 this.$nextTick 之后执行
原文链接:https://juejin.cn/post/7326355171901603875 作者:Johnnie_Walker