
前言
最近接到个业务需求,类似于数据大屏展示图表的功能,需要具备一键换肤和表格转换成为图表的功能,对于我这种老Echarter来说已经是很轻车熟路的操作了,但是由于团队使用的是Vue3+TS还是遇到了些坑点的。


Echart的基本操作
在vue3中,通过npm install echarts可获取到对应的echart资源,在项目文件中建立对应的utils作为引用echart资源的工具库。
@/utils/utils
import * as echarts from "echarts/core"

import { BarChart, LineChart, PieChart, MapChart, PictorialBarChart, RadarChart } from "echarts/charts"

import {
  TitleComponent,
  TooltipComponent,
  GridComponent,
  PolarComponent,
  AriaComponent,
  ParallelComponent,
  LegendComponent,
  RadarComponent,
  ToolboxComponent,
  DataZoomComponent,
  VisualMapComponent,
  TimelineComponent,
  CalendarComponent,
  GraphicComponent
} from "echarts/components"

import { CanvasRenderer } from "echarts/renderers"

echarts.use([
  LegendComponent,
  TitleComponent,
  TooltipComponent,
  GridComponent,
  PolarComponent,
  AriaComponent,
  ParallelComponent,
  BarChart,
  LineChart,
  PieChart,
  MapChart,
  RadarChart,
  CanvasRenderer,
  PictorialBarChart,
  RadarComponent,
  ToolboxComponent,
  DataZoomComponent,
  VisualMapComponent,
  TimelineComponent,
  CalendarComponent,
  GraphicComponent
])

export default echarts
然后再建立个Echart.vue文件
<template>
  <div ref="echartsRef" style="height: 400px; width: 500px">gamePlay</div>
</template>
<script setup lang="ts">
import { ref, onMounted } from "vue"
import echarts from "@/utils/echarts"
const echartsRef = ref()
onMounted(() => {
  const myChart = echarts.init(echartsRef.value)
  // 指定图表的配置项和数据
  const option = {
    title: {
      text: "ECharts 入门示例"
    },
    tooltip: {},
    legend: {
      data: ["销量"]
    },
    xAxis: {
      data: ["衬衫", "羊毛衫", "雪纺衫", "裤子", "高跟鞋", "袜子"]
    },
    yAxis: {},
    series: [
      {
        name: "销量",
        type: "bar",
        data: [5, 20, 36, 10, 10, 20]
      }
    ]
  }

  // 使用刚指定的配置项和数据显示图表。
  myChart.setOption(option)
})
</script>
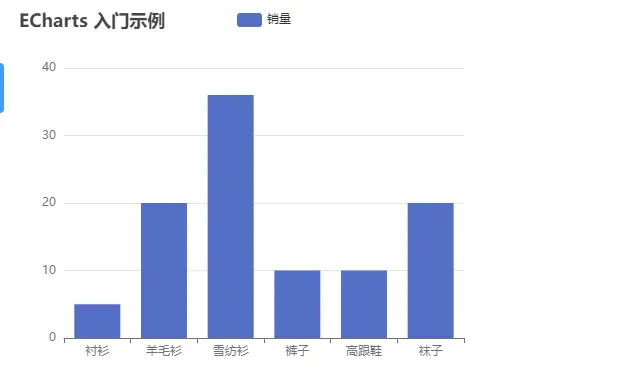
就这么简单就可以渲染出一个echart图表了。
封装useEchartHook渲染图表
虽然我们已经能渲染出图表了,但是这个操作并不是最优解,因为我们的实际业务中是存在很多不同类型的图表,不可能每个都实例化Echart然后再手动调用setOptions方法,这显的很蠢。那么这个时候就需要引入useHookEchart的做法了。
import { Ref, shallowRef, onMounted, onDeactivated, onBeforeUnmount } from "vue"
import echarts from "@/utils/echarts"
export type EChartsCoreOption = echarts.EChartsCoreOption
const useEcharts = (elRef: Ref<HTMLDivElement>, options: EChartsCoreOption) => {
  const charts = shallowRef<echarts.ECharts>()

  const initCharts = () => {
    charts.value = echarts.init(elRef.value)
    setOptions(options)
  }
  const setOptions = (options: EChartsCoreOption) => {
    charts.value && charts.value.setOption(options)
  }
  const echartsResize = () => {
    charts.value && charts.value.resize()
  }
  onMounted(() => {
    window.addEventListener("resize", echartsResize)
  })
  // 防止 echarts 页面 keepAlive 时,还在继续监听页面
  onDeactivated(() => {
    window.removeEventListener("resize", echartsResize)
  })

  onBeforeUnmount(() => {
    window.removeEventListener("resize", echartsResize)
  })
  return {
    initCharts,
    setOptions,
    echartsResize
  }
}
export { useEcharts }
然后再echart.vue中引入
<template>
  <div style="width: 100%; height: 100%" ref="elEcharts" />
</template>
<script setup lang="ts">
import { shallowRef, onMounted, watch } from "vue"
import { useEcharts, type EChartsCoreOption } from "@/hooks/useEcharts"

interface Props {
  options: EChartsCoreOption
}
const props = defineProps<Props>()
const themeStore = useThemeStore()
const elEcharts = shallowRef()
const currentOptions = shallowRef(props.options)
const { setOptions, initCharts } = useEcharts(elEcharts, currentOptions.value)

watch(
  () => props.options,
  (nVal) => {
    let targetOptions: EChartsCoreOption = {}
    if (themeStore.currentColorArray && themeStore.currentColorArray.length > 0) {
      targetOptions = { ...nVal }
      targetOptions.color = themeStore.currentColorArray
    } else {
      targetOptions = { ...nVal }
    }
    setOptions(targetOptions)
  }
)

onMounted(() => {
  initCharts()
})
</script>
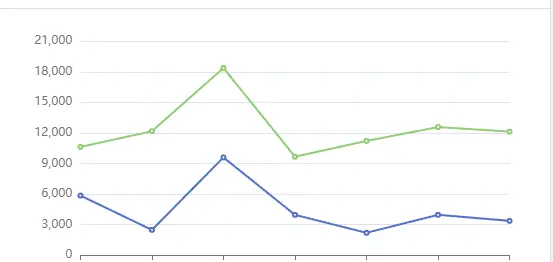
业务中使用
<template>
    <BaseEcharts :options="options2" />
</template>
import BaseEcharts from "@/components/baseEcharts/index.vue"
const options2: EChartsCoreOption = {
  tooltip: {
    trigger: "axis"
  },

  grid: {
    left: "3%",
    right: "4%",
    bottom: "0%",
    top: "5%",
    containLabel: true
  },
  xAxis: {
    type: "category",
    boundaryGap: false,
    data: ["3-1", "3-2", "3-3", "3-4", "3-5", "3-6", "3-7"]
  },
  yAxis: {
    axisLabel: {
      formatter: function (val: number) {
        return val
      }
    }
  },
  series: [
    {
      name: "QQ",
      type: "line",
      stack: "Total",
      data: [200,201,202,203,204,205,206]
    },
    {
      name: "微信",
      type: "line",
      stack: "Total",
      data: [200,201,202,203,204,205,206]
    }
  ]
}
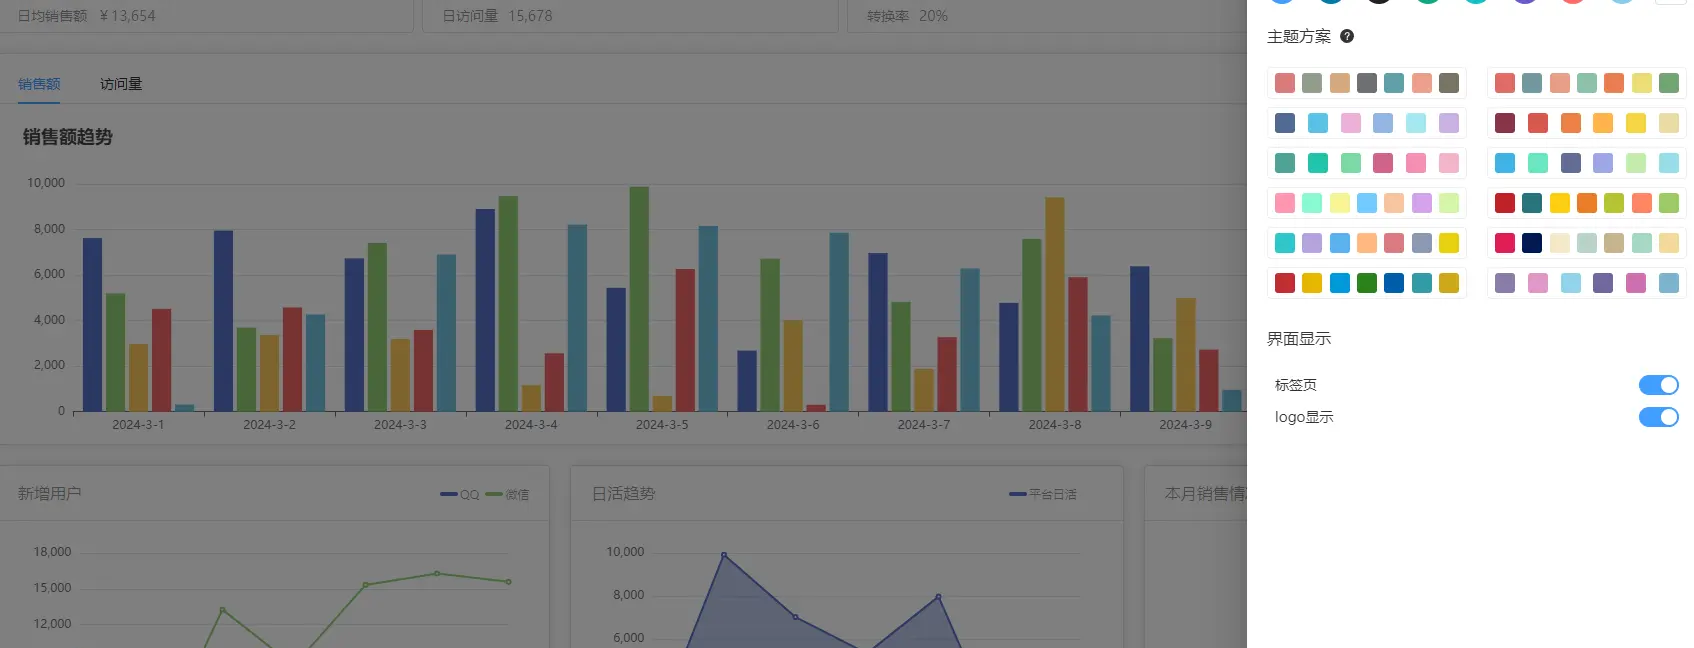
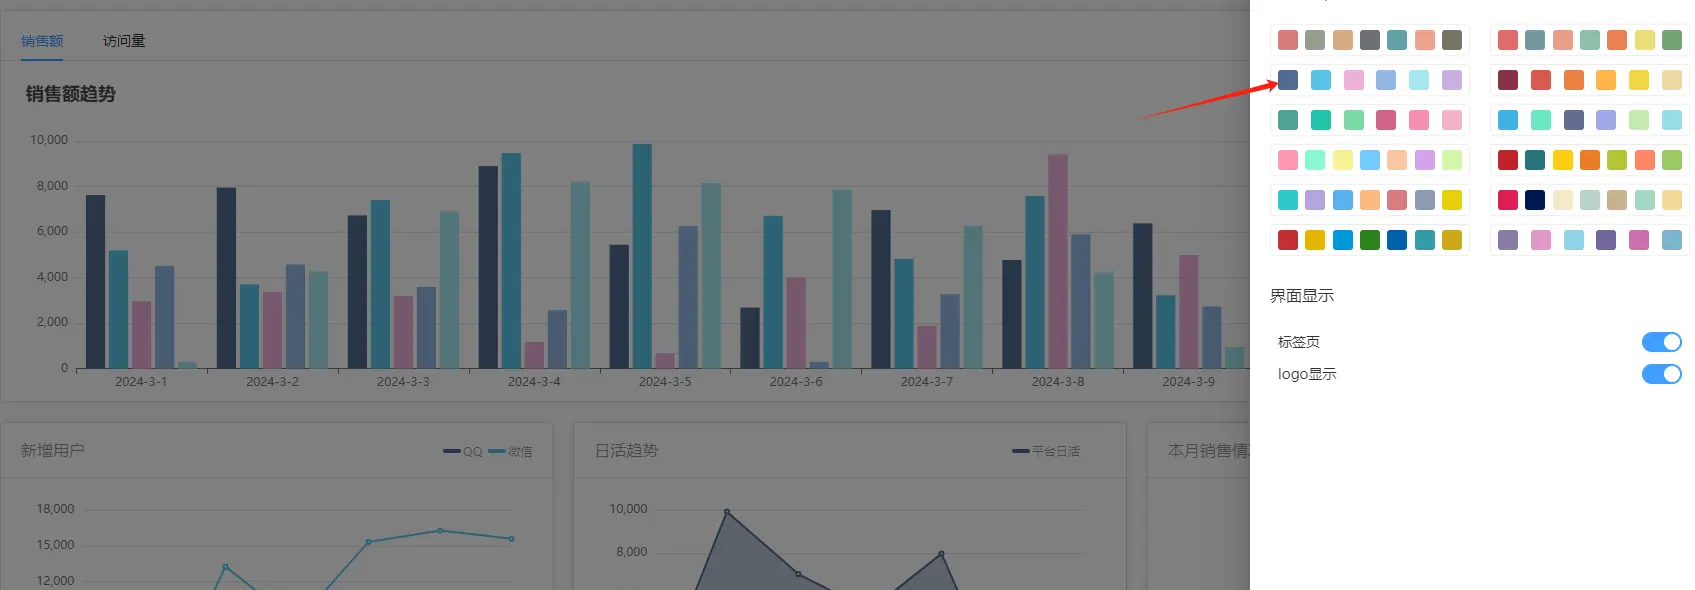
关于Echart主题换肤
由于产品希望图表的主题是可以自由变换的,也就是图表换肤。那好说,因为在echart中可以通过options上的color字段进行自由换主题。这个时候需要改造useEcharts中的initCharts方法
...
 const initCharts = (themeColor?: Array<string>) => {
    charts.value = echarts.init(elRef.value)
    if (themeColor) {
      options.color = themeColor
    }

    setOptions(options)
  }
...
然后再建立themeStore(由于是全局操作,这里使用的pinia)
@/store/themeStore中建立updateCurrentColorByArray方法
import { defineStore } from "pinia"
import { ref } from "vue"
export const useThemeStore = defineStore("themeStore", () => {
 const currentColorArray = ref<string[]>()
  // 根据颜色组更新当前颜色组
  const updateCurrentColorByArray = (color: string[]) => {
    currentColorArray.value = color
  }


  return {
    updateCurrentColorByArray,
    currentColorArray
  }
})
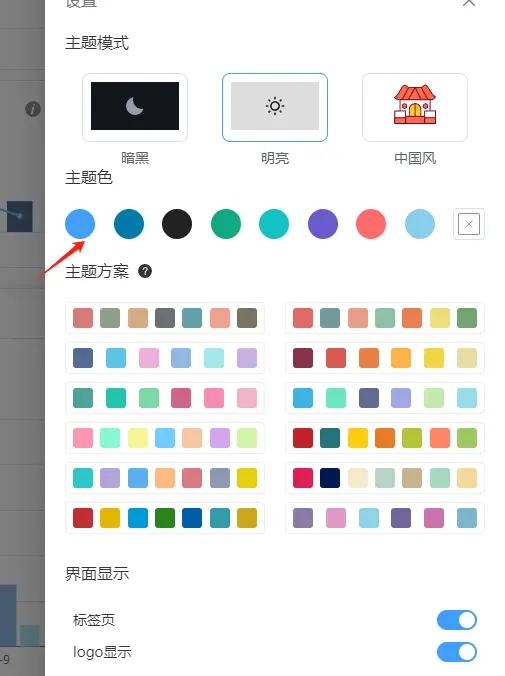
在echartsTheme.ts中预设以下几种主题
在setting.vue中引入themeStore和echartTheme.ts
在echarts.vue中监听currentColorArray变化,重新去设置图表主题即可
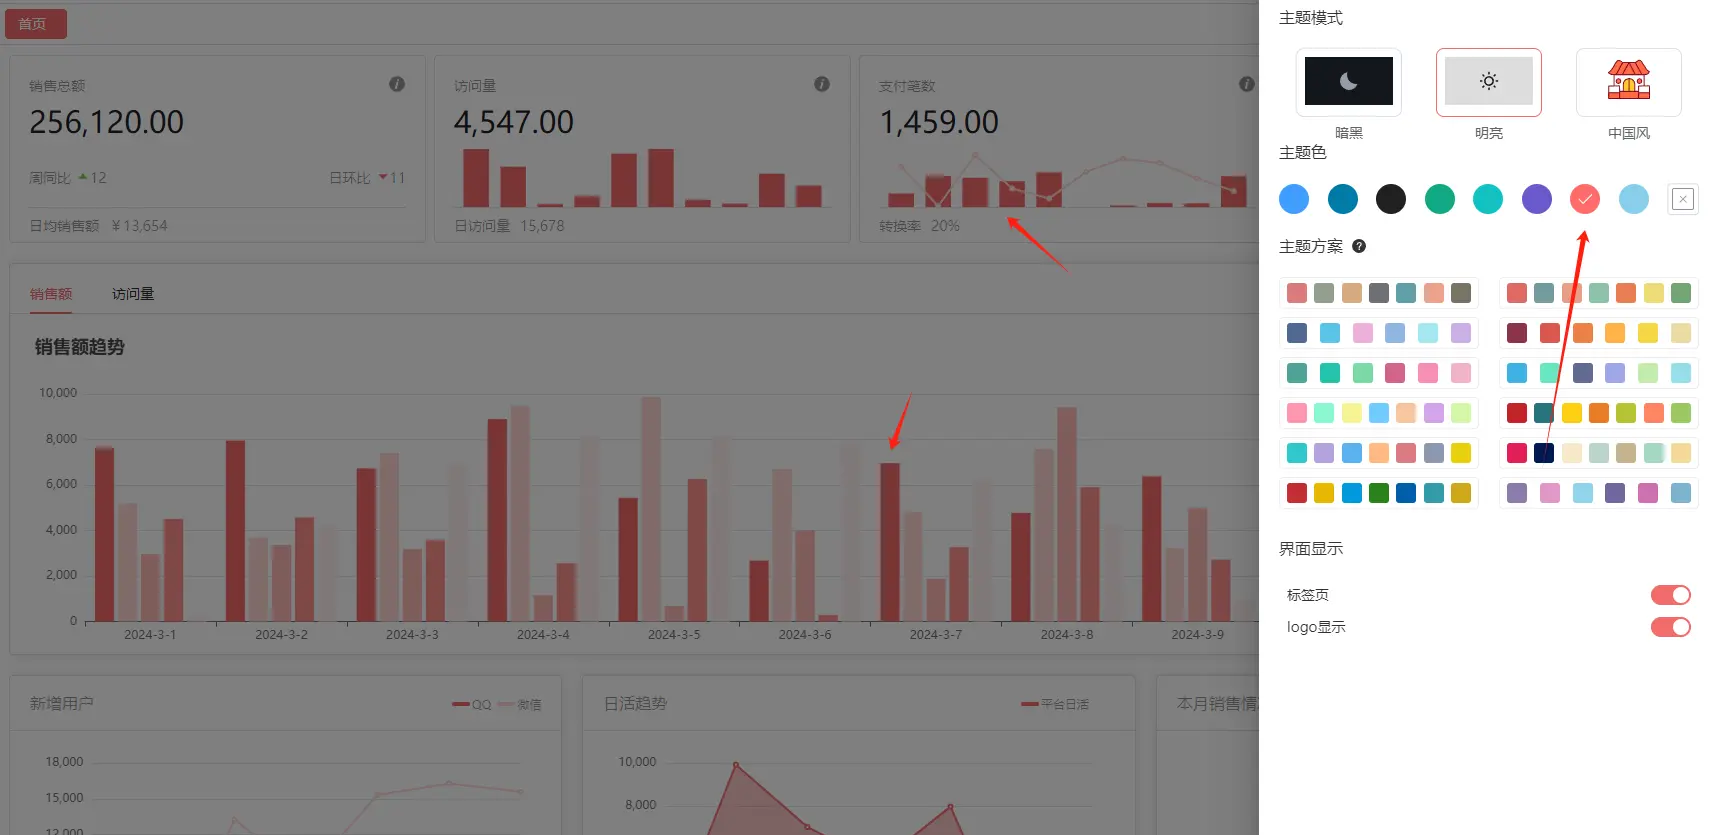
自定义颜色跟新图表主题
当我准备提交代码,关机下班的时候。产品突然说,用户再增加个根据颜色来生成图表的主题,而不是预设的主题。这个时候,我心里真的有1W只草泥马在奔腾。你一个图表目的不就是为了看数据展示吗?搞这么多花里胡哨的干嘛捏?

吐槽归吐槽,班还是要上的,先做个基础布局吧。
tvision-color
根据某个色阶来生成主题,我们可以通过 tvision-color进行操作。
在utils/color.ts
getColorArray方法会返回根据这个色阶返回一系列的相关颜色的数据,其中brandColorIndex为这个色阶的主色。
在themeStore中添加
在业务中customColor.vue中调用

总结
在这过程中,我们使用了Vue3和TS中使用Echart实现一键换肤和根据颜色生成图表主题的功能。通过封装useEchartHook来渲染图表,并使用tvision-color库根据色阶生成颜色组来更新主题。最终实现了用户可以根据自定义颜色来展示图表数据的需求。
原文链接:https://juejin.cn/post/7344567580643000335 作者:迷途小羔羊