使用canvas实现TOPO关系图
使用canvas从基本得一根线、一个形状到一个完整得topo关系图,需要面对那些问题呢?
再社区中有很对基于canvas封装得图库,大大减少了使用canvas得计算等相关成本。比如:
-
konvajs 推荐指数⭐⭐⭐⭐⭐ 上手比较简单,内置一套完整得事件系统。Star: 9.6k。
-
spritejs 推荐指数⭐⭐⭐⭐⭐ 上手比较简单,月影出品:Star: 5.2k
-
Fabric.js 一个简单而强大的HTML5 Canvas库,提供了对图像、对象、文本等元素的操作和渲染,支持图层、缩放、旋转等功能。推荐指数⭐⭐⭐⭐⭐ 示例demo比较多容易上手。 Star: 25.4k.
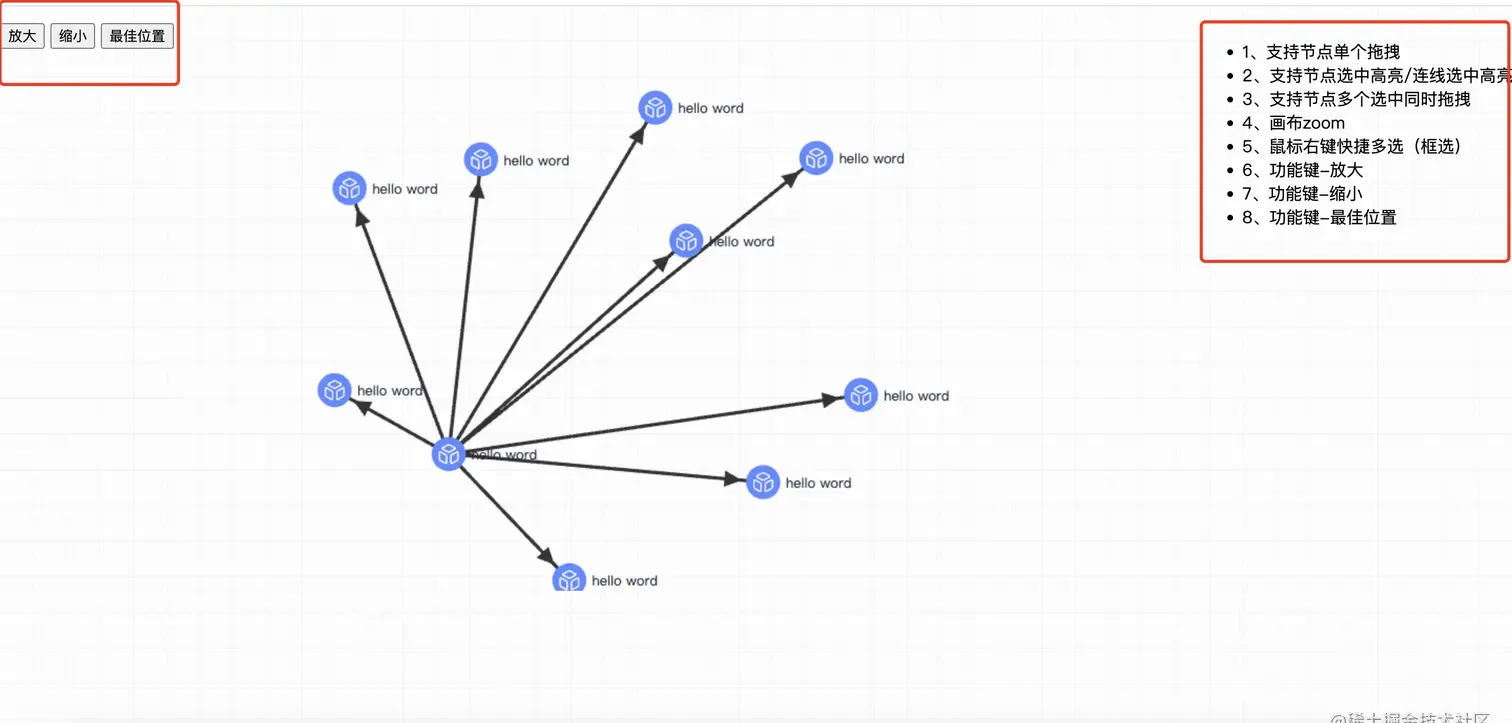
如果这些图库能满足开发要求,当然首选还是这些开源得插件库。那么使用纯canvas去画需要知道那些呢?下面一个使用canvas画topo图得示例带着大家了解canvas。
- 1、支持节点单个拖拽
- 2、支持节点选中高亮/连线选中高亮
- 3、支持节点多个选中同时拖拽
- 4、画布zoom
- 5、鼠标右键快捷多选(框选)
- 6、功能键-放大
- 7、功能键-缩小
- 8、功能键-最佳位置
相关拆解、设计
绘制
topo图基本图形就是两个点,一条连线建立关系。
- 背景圆形(圆形)
- 一个图标(icon)
- 文字描述
- 连线
- 箭头方向
- 连线文字(本次先不做实现演示)
如下图所示:

数据结构也是经典得网络数据结构,如下图(两条节点数据、一条边数据合成一个关系图):
interface NodeProps {
  id: string;
  props?: Record<string, any>;
  x: number;
  y: number;
  [propsName: string]: any;
}

interface EdgeProps {
  id: string;
  target: string;
  source: string;
  props?: Record<string,any>;
  [propsName: string]: any;
}

const nodes = [{
  id: 1,
  x: 0,
  y: 0,
},{
  id: 2,
  x: 10,
  y: 10,
}]

const edges = [
    {
       id: 'edge1',
       target: 1,
       source: 2,
    }
]
canvas 拾取方案使用离屏渲染(通过唯一颜色拾取图形),对canvas比较陌生得可以参考下我的另一篇canvas拾取方案汇总
放大、缩小等相关缩放移动使用d3js的zoom
布局算法使用d3的力导向布局计算下初始位置。
mock关系图数据
准备数据,以下是一个随便生成点关系数据的,就是生成nodeid、edgeid等相关,这个时候节点是不带坐标的。如下:
let initGraphData = {
    idPoint: {},

    init(len) {
        let data = { nodes: [], links: [] }
        for (let i = 0; i < len ; i++) {
            data.nodes.push( { id: i })
            data.links.push({ source: Math.ceil(Math.random(len)), target:  i, value: 1, id: this.getId() })
        }
        return data;
    },

    random(min, max) {
        if (min > max) {
            [min, max] = [max, min]
        }
        return parseInt((Math.random() * (max - min + 1)) + min)
    },

    getId() {
        let id = Date.now() + Math.ceil(Math.random(200))
        while(this.idPoint[id]) {
            id = Date.now() + Math.ceil(Math.random(200))
        }
        this.idPoint[id] = id;
        return id
    }
}

const data = initGraphData.init(200);

console.log(data,'data....'); // 这里就是200个节点的数据
使用d3引力布局算法给mock的数据生成坐标信息
const WIDTH = document.querySelector('body').offsetWidth;
const HEIGHT = 500;

async function initDataTransform() {
        const simulation = d3.forceSimulation(data.nodes)
            .force('link', d3.forceLink(data.links).id(d => d.id).distance(100))
            .force('charge', d3.forceManyBody().strength(-1520))
            .force('xAxis', d3.forceX(WIDTH / 2).strength(0.3))
            .force('yAxis', d3.forceY(HEIGHT / 2).strength(0.7))
            .force('center', d3.forceCenter(100, 100));

        const promise = new Promise(function (resolve, reject) {
            simulation.on("tick", () => {
                if (simulation.alpha() <= 1) {
                    simulation.stop();

                    data.nodes.forEach(item => {
                        item.x = Math.abs(item.x)
                        item.y = Math.abs(item.y)
                    })

                    data.links.forEach(item => {
                        item.source.x = Math.abs(item.source.x)
                        item.source.y = Math.abs(item.source.y)
                        item.target.x = Math.abs(item.target.x)
                        item.target.y = Math.abs(item.target.y)
                    })
                    resolve(data);
                }
            });
        })
        return promise;
    }

initDataTransform(); // 这个是给data 数据添加x、y信息
绘制节点、边
绘制基本图形
let helperCanvasId = {
        idPool: {},
        createOnceId() {
            return Array(3)
            .fill(0)
            .map(() => Math.ceil(Math.random() * 255))
            .concat(255)
            .join("-");
        },

        idToRgba(id) {
           return id.split("-");
        },

        rgbaToId(rgba) {
         return rgba.join("-");
        },

        createId() {
          let id = this.createOnceId();
          while (this.idPool[id]) {
            id = this.createOnceId(e);
          }
         return id;
        }
    };


// 绘制节点
function drawNode(dragId = []) {
        let { nodes, links } = data;
        nodes.forEach(item => {
            let { x, y } = item
            let dX = 0, dY = 0;
            if(dragId.includes(item.id)) {
                dX = diffX; // 这里是拖拽的再这里可以先不关心
                dY = diffY;
            }


            ctx.save()
            ctx.fillStyle = selectNodeList.includes(item.id) ? 'red' : '#5C89FF'; // 选中的时候绘制成红色、没选中的默认颜色
            const path = new Path2D();
            path.arc(x + dX, y + dY , 15, 0, Math.PI * 2, false)
            ctx.fill(path) // 绘制圆
            ctx.restore()
            ctx.drawImage(img, x + dX - 10, y + dY - 10, 20, 20); // 绘制icon img是我的base64 icon

            ctx.save();
            ctx.font = '12px 微软雅黑';
            ctx.textAlign = 'start'; // 绘制文字
            ctx.fillStyle = selectNodeList.includes(item.id) ? 'red' : '#1D2939'
            ctx.fillText('hello word', x + dX + 20, y + dY + 5);
            ctx.restore();
        })
    }

     // 绘制离屏渲染的图形
     function osCtxDrawNode(dragId = []) { // 离屏渲染(通过唯一颜色拾取图形) 主要用来做事件系统的
        let { nodes, links } = data;
        nodes.forEach(item => {
            const id = helperCanvasId.createId();
            let { x, y } = item;

            let dX = 0, dY = 0;
            if(dragId.includes(item.id)) {
                dX = diffX;
                dY = diffY;
            }

            item.nodeId = id;


            const [r, g, b, a] = helperCanvasId.idToRgba(id);
            shapeMap.set(id, item);
            osCtx.save()
            osCtx.beginPath();
            osCtx.fillStyle = `rgba(${r}, ${g}, ${b}, ${a})`;
            osCtx.strokeStyle = `rgba(${r}, ${g}, ${b}, ${a})`;
            osCtx.arc(x + dX, y + dY , 15, 0, Math.PI * 2, false)
            osCtx.fill();
            osCtx.stroke();
            osCtx.restore();
        })
    }
绘制连线
 //绘制连线
   async function drawLink(dragId = []) {
        let { nodes, links } = data
        links.forEach(async item => {
            let {x: sourceX, y: sourceY} = nodeMap.get(item.source.id); // 获取source 节点的坐标x、y
            const { x: targetX, y: targetY  } = nodeMap.get(item.target.id);// 获取target 节点的坐标x、y

            let sX = 0, sY = 0, tX = 0, tY = 0;
            if(dragId.includes(item.source.id)) { // 判断拖拽的diff x、y
                sX = diffX;
                sY = diffY;
            }
            if(dragId.includes(item.target.id)) {// 判断拖拽的diff x、y
                tX = diffX;
                tY = diffY;
            }
            const lineColor = selectEdgeList.includes(item.id) ? 'red' : '#333'; // 是否被选中

            ctx.save();
            const path = new Path2D();
            path.moveTo(sourceX + sX, sourceY + sY); // 原位置信息添加上拖拽的距离,默认拖拽距离为0
            path.lineTo(targetX + tX, targetY + tY);
            ctx.strokeStyle = lineColor;
            ctx.lineWidth = 3;
            ctx.stroke(path);
            ctx.restore();

            // 绘制连线箭头
            const { offsetX, offsetY } = arrowOffset(sourceX + sX, sourceY + sY,targetX + tX, targetY + tY, offset = 20);
           await drawLineArrow(sourceX + sX, sourceY + sY, offsetX, offsetY, lineColor);
        })
    }

   // 绘制离屏渲染(通过唯一颜色拾取图形)的连线
  function osCtxDrawLink(dragId = []) {
        let { nodes, links } = data
        links.forEach(item => {
            const id = helperCanvasId.createId();

            item.edgeId = id;
            let {x: sourceX, y: sourceY} = nodeMap.get(item.source.id);
            const { x: targetX, y: targetY  } = nodeMap.get(item.target.id);
            let sX = 0, sY = 0, tX = 0, tY = 0;
            if(dragId.includes(item.source.id)) {
                sX = diffX;
                sY = diffY;
            }
            if(dragId.includes(item.target.id)) {
                tX = diffX;
                tY = diffY;
            }

            const [r, g, b, a] = helperCanvasId.idToRgba(id);
            shapeMap.set(id, item);

            osCtx.save()
            osCtx.beginPath();
            osCtx.lineWidth = 3;
            osCtx.moveTo(sourceX + sX, sourceY + sY)
            osCtx.lineTo(targetX + tX, targetY + tY)
            osCtx.strokeStyle = `rgba(${r}, ${g}, ${b}, ${a})`;
            osCtx.stroke();
            osCtx.restore();
        })
    }
绘制连线箭头
    function arrowOffset(fromX, fromY, toX, toY, offset ) {
        const deg = Math.atan2(fromY - toY, fromX - toX) * 180 / Math.PI;
        const offsetX =  toX + (20 * Math.cos(deg * Math.PI / 180))
        const offsetY =  toY + (20 * Math.sin(deg * Math.PI / 180))
        return { offsetX, offsetY }
    }


    function drawLineArrow(fromX, fromY, toX, toY, lineColor) {
        const len = 15;//自定义箭头线的长度
        const theta = 25;//自定义箭头线与直线的夹角
        let arrowX, arrowY;//箭头线终点坐标

        const angle = Math.atan2(fromY - toY, fromX - toX) * 180 / Math.PI;
        const angle1 = (angle + theta) * Math.PI / 180;
        const angle2 = (angle - theta) * Math.PI / 180;


        const topX = len * Math.cos(angle1);
        const topY = len * Math.sin(angle1);
        const botX = len * Math.cos(angle2);
        const botY = len * Math.sin(angle2);

        ctx.save();
        ctx.beginPath();
        arrowX = toX + topX;
        arrowY = toY + topY;
        //画上边箭头线
        ctx.moveTo(arrowX, arrowY);
        ctx.lineTo(toX, toY);
        arrowX = toX + botX;
        arrowY = toY + botY;
        //画下边箭头线
        ctx.lineTo(arrowX, arrowY);
        ctx.fillStyle = lineColor;
        ctx.strokeStyle = lineColor;
        ctx.closePath();
        ctx.fill();
        ctx.stroke();
        ctx.restore();
    }
使用d3-zoom给画布添加平移、缩放
  function startZoom() {
        zoom = d3.zoom()
        .scaleExtent([0, 8])
        .on("zoom", zoomed);
        d3.select('.graph-container').call(zoom).on('dblclick.zoom', null);
    }
    function zoomed() {
        if(nodeAbout) return
        transform = d3.zoomTransform(this);
        redraw() //画布缩放了 重绘画布
    }
    function zoomIn() { // 缩小
        d3.select('.graph-container').transition().call(zoom.scaleBy, 0.7);
    }
    function zoomOut() { // 放大
        d3.select('.graph-container').transition().call(zoom.scaleBy, 1.3);
    }
    function zoomCenter(duration = 100) { // 最佳位置、居中
        const containerX = data.nodes.map(item => item.x);
        const containerY = data.nodes.map(item => item.y);

        const minX = Math.min.apply(null, containerX);
        const maxX = Math.max.apply(null, containerX);
        const minY = Math.min.apply(null, containerY);
        const maxY = Math.max.apply(null, containerY);

        const containerGraphBBox = {
            width: maxX - minX,
            height: maxY - minY,
            x: minX,
            y: minY
        };
        const scaleX = WIDTH / containerGraphBBox.width;
        const scaleY = HEIGHT / containerGraphBBox.height;
        const k = Math.min(scaleX, scaleY) * 0.9;

        const translateByX = WIDTH / 2 - (containerGraphBBox.width / 2 * k) - (containerGraphBBox.x * k);
        const translateByY = HEIGHT / 2 - (containerGraphBBox.height / 2 * k) - (containerGraphBBox.y * k);

        transform = d3.zoomIdentity
            .translate(translateByX, translateByY)
            .scale(k);

        d3.select('.graph-container').transition()
            .duration(duration)
            .call(zoom.transform, transform);
    }
给节点、边绑定事件
 canvas.onclick = async function(event) {
        const x = event.offsetX;
        const y = event.offsetY;
        const rgba = osCtx.getImageData((x), (y), 1, 1).data;
        const id = helperCanvasId.rgbaToId(rgba);
        const item = shapeMap.get(id);
        if(isBrush) return;

        if(item && !dragging) { // 需要判断是不是拖拽中
            if(item.hasOwnProperty('nodeId')) { // 判断是节点还是边
                selectNodeList.push(item.id)
            }
            if(item.hasOwnProperty('edgeId')) {
                selectEdgeList.push(item.id)
            }
        }else {
            selectNodeList = [];
            selectEdgeList = [];
        }
        if(dragging) {
            dragging = false;
            return
        }
        redraw()
    };

// 绑定右键事件
canvas.oncontextmenu = function(event) {
        if(!isBrush) {
            event.stopPropagation();
            canvas.style.cursor = 'crosshair';
            isBrush = true;
        }else {
            event.stopPropagation();
            canvas.style.cursor = '';
            isBrush = false;
        }
        return false;
    };


  // 鼠标摁下事件
  canvas.onmousedown = function(event) {
        const x1 = event.offsetX;
        const y1 = event.offsetY;
        const rgba = osCtx.getImageData(x1, y1, 1, 1).data;
        const id = helperCanvasId.rgbaToId(rgba);
        const item = shapeMap.get(id);
        nodeAbout = item ? true : false;

        if(item && item.hasOwnProperty('nodeId') && !isBrush) {
            event.stopPropagation();
            event.stopPropagation();
            nodeDrag(x1, y1, item.id); // 节点拖拽
        }

        if(isBrush) {
            event.stopPropagation();
            event.stopPropagation();
            drawBrush(x1, y1); // 框选事件
        }
    };
...
节点拖拽
function nodeDrag(x1, y1, nodeId) { // x1、y1是再节点上摁下鼠标得当前位置
        let dragId = []
        document.onmousemove = function(eventMove) {
            const x2 = eventMove.offsetX;
            const y2 = eventMove.offsetY;


            diffX = (x2 - x1) /  transform.k; // 需要考虑当前得缩放值
            diffY = (y2 - y1) /  transform.k;// 需要考虑当前得缩放值
            if(diffX || diffX) {
                dragging = true
            }
            dragId = selectNodeList.includes(nodeId) ? selectNodeList : [nodeId] // 需要考虑多个节点拖拽得场景
            redraw(dragId)
        }

        document.onmouseup = function() {
            document.onmousemove = null;
            document.onmouseup = null;
            //鼠标放下更改坐标
            dragId.forEach(item => {
                let nodeItem = nodeMap.get(item);
                nodeItem.x = nodeItem.x  + diffX // 更改实际坐标
                nodeItem.y = nodeItem.y  + diffY
            })

            setTimeout(() => {
                dragging = false;
                diffX = 0;
                diffY = 0;
            },100)
        }
    }
框选功能
其实框选就是画了一个矩形,然后计算在矩形内得节点。需要考虑框选是可以由上而下、还可以由下而上。
function drawBrush(x1, y1) {
        let x2, y2;
        document.onmousemove =  async function(eventMove) {
            x2 = eventMove.offsetX;
            y2 = eventMove.offsetY;
            const w = (x2 - x1);
            const h = (y2 - y1);
           await redraw();

            ctx.save();
            ctx.rect(x1, y1, w, h);
            ctx.strokeStyle = '#fff';
            ctx.fillStyle = 'rgba(119, 119, 119, 0.3)';
            ctx.fill();
            ctx.stroke();
            ctx.restore();
        };

        document.onmouseup = function() {
            document.onmousemove = null;
            document.onmouseup = null;
            canvas.style.cursor = '';
            const brushRange = data.nodes.filter(item => {
                x = (item.x * transform.k + transform.x); // 计算当前缩放后的坐标
                y = (item.y * transform.k + transform.y);

                if(x1 < x2) { // 这里需要注意
                    if(x >= x1 & x <= x2 & y >= y1 & y <= y2) {
                        return item
                    }
                }else {
                    if(x >= x2 & x <= x1 & y >= y2 & y <= y1) {
                        return item
                    }
                }

            });


            selectNodeList = brushRange.map(item => item.id);
            redraw();

            setTimeout(() => {
                isBrush = false;
                console.log(isBrush, isBrush,isBrush,isBrush)
            },100)
        }
    }
总结
基于canvas实现topo图的示例就如上就可以了。代码仓库地址
- 注意点一:节点、边点击事件里面需要判断是不是节点拖拽,这些状态的相关管理。
- 注意点二:框选要注意判断由上而下、由下而上的两种方式都要做相关判断。
原文链接:https://juejin.cn/post/7259360945398988857 作者:三原