
目标
本文将使用 D3 实现 Echarts 中两个交互强的通用图表:

为什么要用 D3
使用 D3.js 开发可视化图表有以下几个优点。
- 功能丰富:D3.js 提供了许多丰富的数据可视化功能,比如缩放、交互、布局、动画等等,能够帮助开发者快速创作各种类型的图表,并且容易扩展。
- 自定义程度高:使用 D3.js 可以灵活控制所有图表的元素,包括图形、轴、标签、交互等等,可根据业务需求随意定制化图表。
- 界面友好:D3.js 提供了类似 JQuery 的 DOM 操作方法,偏向函数式编程,使开发者能够方便地对图表进行操作,同时 D3 还提供了大量的样式和布局辅助方法,可以便捷地定义图表样式和布局。
- 社区活跃:D3.js 拥有庞大的开发社区,有大量 D3.js 的相关资料、代码示例和插件,能够帮助开发者更加高效地开发可视化图表。
- 兼容性好:D3.js 对各种浏览器的兼容性都很好,支持 IE6+ 和现代浏览器等多种浏览器,能够保证图表在各种不同浏览器环境下的稳定性和可用性。
理解数据驱动视图
我们知道 D3 这个库出色在于数据驱动视图的理念,那么如何理解呢?
在以往编写 SVG、Canvas 都需要一行一行编写样式和属性,并没有一个统一的数据管理,数据和视图关联性很弱。所以,在 D3 中强调数据,数据驱使视图的更新,在 D3 中数据和 DOM 元素进行绑定,并使用这些数据来更新元素的属性、样式、位置等,从而实现动态的数据可视化效果,说白了就是链式调用、状态封装来方便我们更新视图。
理解数据驱动视图的理念后,我们在绘图的时候要知道视图元素和数据是强绑定的。当知道数据是什么,通过 D3 可以反推出元素的坐标位置;当知道元素的坐标位置,也能知道数据 data 是多少。比如,要获取图上 x 轴的数据对应的 x 坐标,我们可以通过 xScale(value) 快速获取。
实现柱状图
了解完 D3 的开发优势及出色理念后,下面我们一起来“理论结合实践”,首先实现我们常用的柱状图。
其实,实现柱状图等其他图都会遵循一个套路:
- 定义数据集;
- 定义绘图区域(安全边界 margin + 生成 SVG 的绘图区域);
- 设置比例尺;
- 生成坐标轴;
- 绘制图元。
还是比较好理解的,对吧?接下来我们就按照这个“套路”,一步一步去实现我们想要的柱状图。
- 定义我们的数据集:
// 数据
const data = [
    { label: "A", value: 20 },
    { label: "B", value: 50 },
    { label: "C", value: 30 },
    { label: "D", value: 80 },
    { label: "E", value: 40 },
];
- 定义绘图区域。定义我们基础图表所在的 SVG 可视区域内部的某一块位置,一般我们理解为安全区域的边距,以防止图表某些元素丢失。
// 配置
const margin = { top: 20, right: 20, bottom: 30, left: 40 };
const width = 960 - margin.left - margin.right;
const height = 500 - margin.top - margin.bottom;
下面我们将添加我们的绘制区域,select 类似我们 querySelector 查找对应容器,设置宽和高,传入 g 标签(g 标签用于分组,类似 div),然后移动到对应位置。
const svg = d3.select("#chart")
    .attr("width", width + margin.left + margin.right)
    .attr("height", height + margin.top + margin.bottom)
    .append("g")
    .attr("transform", "translate(" + margin.left + "," + margin.top + ")");
- 设置比例尺:
const x = d3.scaleBand()
    .domain(data.map(function (d) { return d.label; }))
    .range([0, width])
    .padding(0.1);

const y = d3.scaleLinear()
    .domain([0, d3.max(data, function (d) { return d.value; })])
    .range([height, 0]);
上文通过 scaleBand 离散数据的比例尺传入 domain(数据域) ,然后 range 定义值的范围,让每个 label 的值映射到 range 的 [0, width],最后设置 padding 代表柱子间的间距。在 Y 轴,我们一般是连续的值代表大小的关系,这个时候需要使用 scaleLinear 来实现。
为了更好地理解,下面我罗列了这些方法的解释。
-
scaleBand:D3 的比例尺游程,用于将
离散的数据到连续的空间范围内,并按照一定的方式进行分组和排序。在柱状图、条形图等图表中,通常用于定义 x 轴的比例尺,将不同的类别或标签映射成一定的长度。 -
scaleLinear:D3 的线性比例尺,用于将
连续的数据到连续的空间范围内。在柱状图、折线图等图表中,通常用于定义 y 轴的比例尺,将原始数据映射到实际的高度或者纵坐标位置上。 -
domain:比例尺的
定义域,表示原始数据的范围。 -
range:比例尺的
值域,表示将原始数据映射到的连续空间的范围。 -
padding:
d3.scaleBand()比例尺中的分组间距,即每组数据之间的空白宽度。
为了避免有小伙伴有疑问,这里我也额外简单介绍下“数据域”和“比例尺”。
数据域
在数据可视化中,通常使用坐标轴来表示数据的范围。数据范围指的是原始数据的取值范围,而数据域(或称值域)指的是数据在可视化过程中映射到画布上的范围。
例如,假设有一个包含以下数据的数组:
[10, 20, 30, 40, 50]这个数组的数据范围为 10 到 50。我们可以使用线性比例尺将这些数据映射到值域为 0 到 400 的可视化空间上。在这种情况下,数据点 10 将映射到像素 0,数据点 50 将映射到像素 400。每个数据点在值域中对应了一个唯一的像素位置。
比例尺
比例尺(Scale)是一种将数据值映射到视觉表示时使用的函数。它们将输入域(例如数据的原始值)中的值映射到输出域(例如图表的坐标轴长度或颜色)中的值,以便更好地表现数据的分布和关系。
以下是其中几种比例尺的标准:
- 线性比例尺,将坐标轴上的数据线性地映射到屏幕上的像素值。例如,如果数据范围从 0 到 100,则比例尺将保持数据点之间的线性距离。这意味着在图表上,两个数据点之间的距离和它们在坐标轴上的距离是成比例的。线性比例尺适用于大多数情况,可以处理常规的数据范围。
- 对数比例尺,将坐标轴上的数据按对数比例映射到屏幕上的像素值。对数比例尺的作用是将取值范围很宽的数据,压缩到一个较小的范围,以便更好地可视化。适合处理数据取值范围较大,或者存在比例差异较大的场景。
- 时间比例尺,将坐标轴上的时间数据映射到屏幕上的像素值。时间比例尺通常用于可视化时间序列数据,如股票价格、气象数据等。以时间为坐标轴的数据,需要按照特定的粒度进行组织和映射,如按天、按周、按月等。
- 生成坐标轴:
// X轴
svg.append("g")
    .attr("class", "x axis")
    .attr("transform", "translate(0," + height + ")")
    .call(d3.axisBottom(x));

// Y轴
svg.append("g")
    .attr("class", "y axis")
    .call(d3.axisLeft(y).ticks(10));
这里需要注意 call 的用法用于修改 this 的指向,这里可以简单理解为将 SVG 的对象 this 绑定到 d3.axisBottom(x) 返回的构造函数上,也就意味着这个构造函数可以直接操作 SVG 对象,而不用多余传入 SVG 对象。
- 绘制柱体
下面这段代码的意思是,选择 SVG 上所有 class 为 bar 的元素,若不存在则创建。然后将数据与选择集绑定,由于元素未创建使用 enter 来创建占位的节点,append 传入 rect 代表创建矩形,最后定义类名、坐标、宽高。
// 柱形
svg.selectAll(".bar")
    .data(data)
    .enter().append("rect")
    .attr("class", "bar")
    .attr("x", function (d) { return x(d.label); })
    .attr("y", function (d) { return y(d.value); })
    .attr("width", x.bandwidth())
    .attr("height", function (d) { return height - y(d.value); });
绘制效果如下:
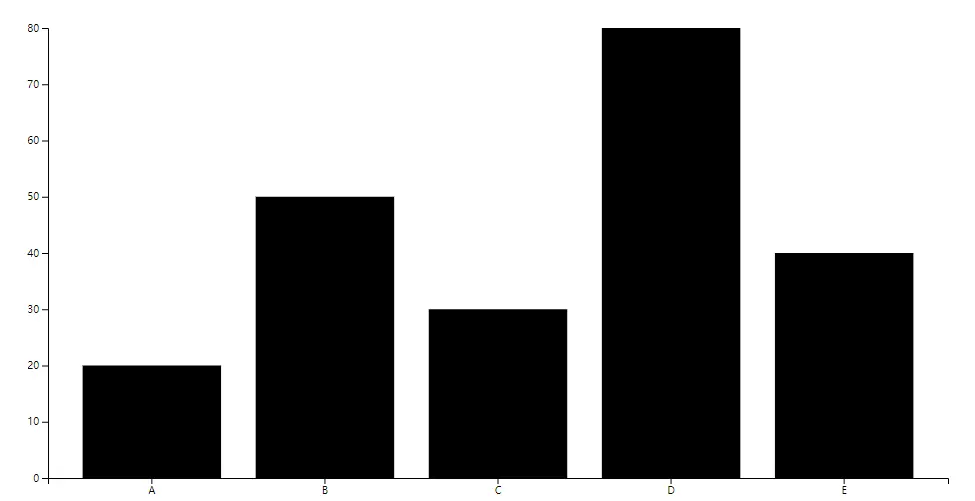
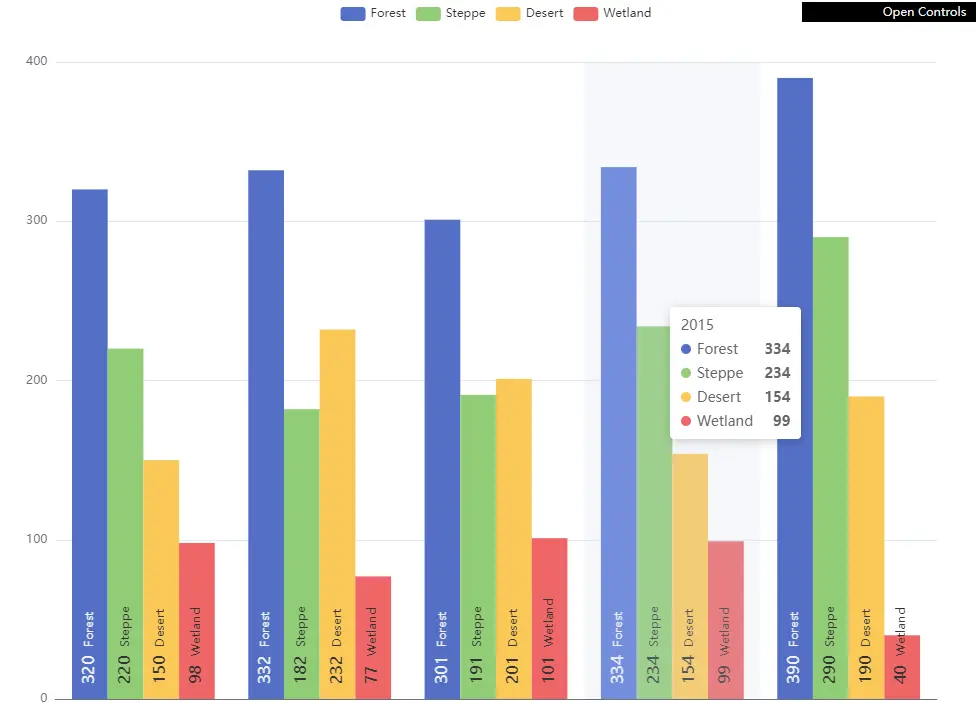
实现多层级旋转标签柱状图
ECharts 的柱状图示例
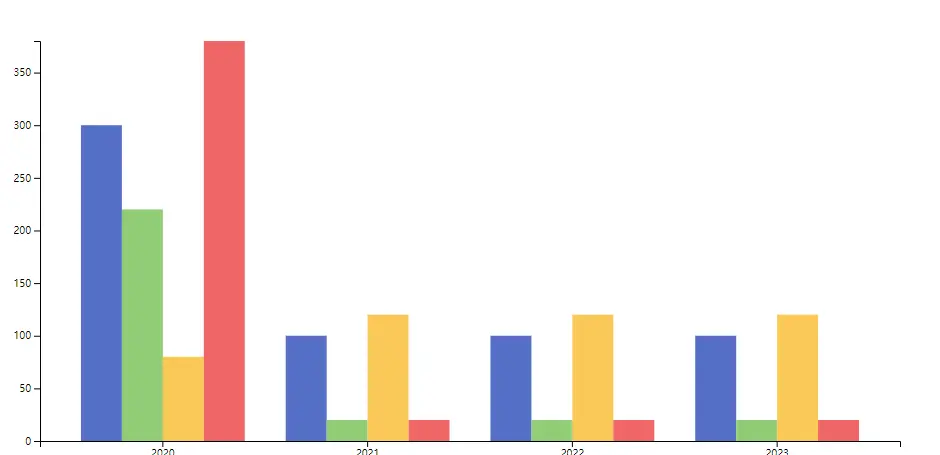
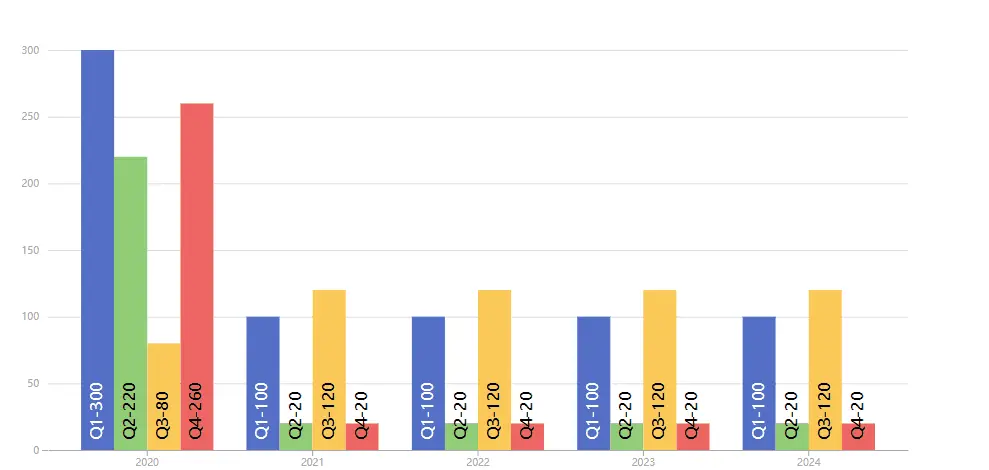
有了上文的基础,我们接下来将要实现一个相对复杂业务场景下的 ECharts 的柱状图示例:

首先,我们要清楚这里只不过分了 4 个组,每个组放了 4 个季度的柱子,而柱子的间距我们可以通过 padding 来实现。初学者可能很喜欢用循环来将每组进行定位,其实在 D3 处理这些十分简单,我们可以像下面这样不断用类似同步的写法避免嵌套,这样的代码十分容易维护。
const group = chart.selectAll(".group").data(data)
group.selectAll("rect")
下面是代码的整体实现:
// 定义数据结构
// 定义数据结构
const data = [
{
label: "2020",
season: [
{ label: "Q1", value: 300 },
{ label: "Q2", value: 220 },
{ label: "Q3", value: 80 },
{ label: "Q4", value: 400 },
],
},
{
label: "2021",
season: [
{ label: "Q1", value: 100 },
{ label: "Q2", value: 20 },
{ label: "Q3", value: 120 },
{ label: "Q4", value: 20 },
],
},
{
label: "2022",
season: [
{ label: "Q1", value: 100 },
{ label: "Q2", value: 20 },
{ label: "Q3", value: 120 },
{ label: "Q4", value: 20 },
],
},
{
label: "2023",
season: [
{ label: "Q1", value: 100 },
{ label: "Q2", value: 20 },
{ label: "Q3", value: 120 },
{ label: "Q4", value: 20 },
],
},
];
// 每年4个季度
const seasonLen = 4
// 统计年的数量
const yearLen = data.length
const colors = ['#5470C6', '#91CC75', '#fac858', '#ee6666']
const svgWidth = 960;
const svgHeight = 500;
// 定义图幅大小
const margin = { top: 50, right: 50, bottom: 50, left: 50 };
const chartWidth = svgWidth - margin.left - margin.right;
const chartHeight = svgHeight - margin.top - margin.bottom;
const svg = d3.select("svg")
.attr("width", svgWidth)
.attr("height", svgHeight);
// 创建比例尺
const xScale = d3.scaleBand()
.domain(data.map(d => d.label))
.range([0, chartWidth])
.padding(.2)
const yScale = d3.scaleLinear()
.domain([0, d3.max(data, d => d3.max(d.season, s => s.value))])
.range([chartHeight, 0]);
// 获取每个柱子的宽度
const columWidth = (xScale.bandwidth() / seasonLen)
// 创建图表的根节点
const chart = svg.append("g")
.attr("transform", `translate(${margin.left},${margin.top})`);
// 创建坐标轴
chart.append("g")
.attr("transform", `translate(0,${chartHeight})`)
.call(d3.axisBottom(xScale));
chart.append("g")
.call(d3.axisLeft(yScale));
// 创建group组,存不同年份的分组节点
const group = chart.selectAll(".group")
.data(data)
.enter()
.append("g")
.attr("class", "group")
.attr("transform", (d) => `translate(${xScale(d.label) + columWidth},0)`);
// 在这些分组节点中,插入每个季度的rect节点
group.selectAll("rect")
.data(d => d.season)
.enter()
.append("rect")
.style('fill', (d, i) => colors[i])
.attr("x", d => columWidth * (["Q1", "Q2", "Q3", "Q4"].indexOf(d.label) - 1))
.attr("y", d => yScale(d.value))
.attr("width", xScale.bandwidth() / seasonLen)
.attr("height", d => chartHeight - yScale(d.value));
实现效果如下:
坐标轴优化
我们可以发现坐标轴出了细节问题,我们需要去除 x 轴和 y 轴的刻度细线。
我们可以用 tickSizeOuter 清除 x 轴两端的刻度。用 tickSize 清除内部的刻度,在 y 轴我们控制下间隔后,同样清除下两端刻度。
d3.axisBottom(xScale).tickSizeOuter(0)
d3.axisLeft(yScale).ticks(5).tickSizeOuter(0)
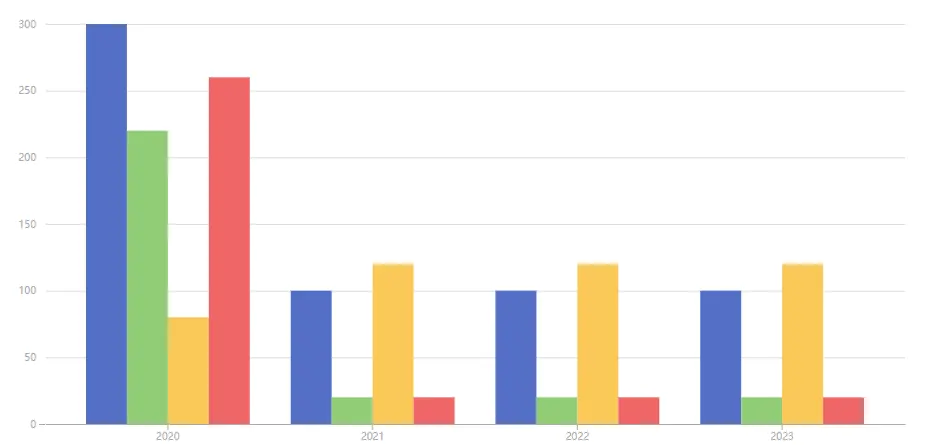
辅助线优化
另外,y 轴的辅助线怎么实现呢?
其实我们可以利用刻度,因为刻度本身就是 line 标签,修改 x2 的坐标值来生成 y 轴的辅助线。这里有个需要注意的地方,在生成辅助线的时候要排除 y 轴的 0 值辅助线,因为该辅助线会和 x 轴重合。
// 这里我们可以巧妙使用y轴刻度,因为本质就是line标签,修改x2的坐标值即可
chart.selectAll(".y-axis .tick line").filter((d, i) => i > 0).attr("x2", svgWidth - margin.left - margin.right).attr("stroke", "#aaa").attr("stroke-width", .4);;
chart.select(".y-axis path").style("display", "none");
隐藏柱子后,展示只有坐标轴和辅助线的图,我们可以很清楚地看到变化:
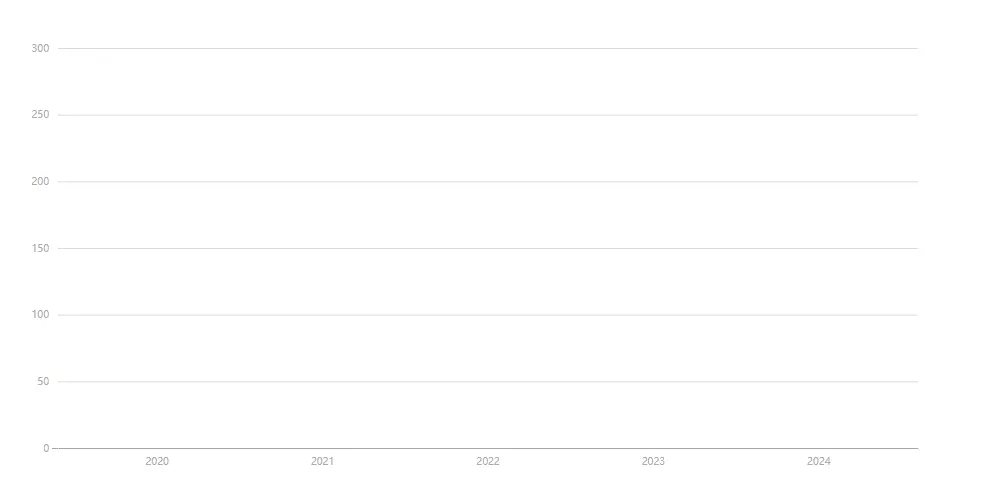
优化后的效果图如下:
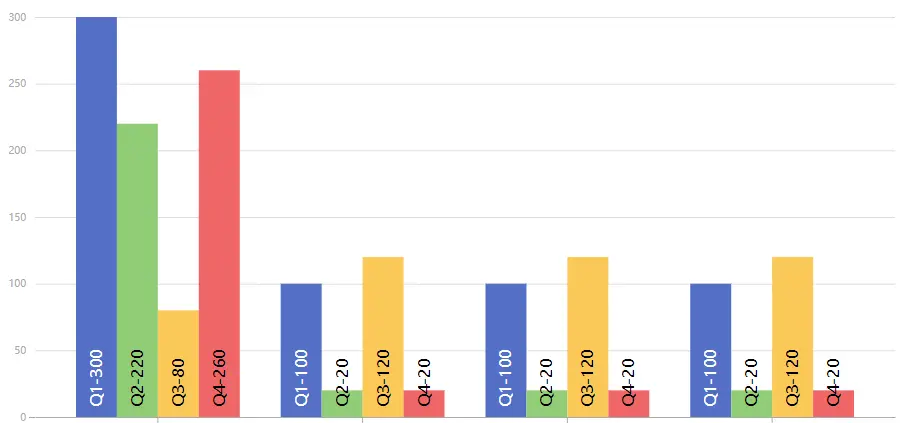
新增旋转标签
接着我们对图表做些“装饰”:每个柱子的底部文案怎么对齐呢?
我们可能会想到用 CSS 的定位做,但在这里 SVG 是不支持的,我们只能修改坐标值,根据文案的字符长度做偏移。同时这里要注意用 function 来获取当前的 this 上下文。通过 this.getBoundingClientRect().height 可以方便获取宽度。
group.selectAll("text")
.data(d => d.season)
.enter()
.append("text")
.text((d, i) => {
console.warn(d, i);
return `${d.label}-${d.value}`
})
.attr("x", d => columnWidth * (["Q1", "Q2", "Q3", "Q4"].indexOf(d.label) - 1) + 10)
.attr("y", function (d) {
const textHeight = this.getBoundingClientRect().height; // 获取文本高度
return chartHeight + textHeight; // 加上一些偏移量,使文本位于 X 轴上方
})
.attr('fill', '#000')
.attr("transform", (d, i) => { // 使用 transform 属性旋转文本
const x = columnWidth * (["Q1", "Q2", "Q3", "Q4"].indexOf(d.label) - 1);
const y = chartHeight;
return `rotate(270 ${x} ${y})`; // 在元素的中心点处旋转90度
}).filter((d, i) => i === 0).attr('fill', '#fff')
效果如下:
最后,我们要再给图表加一些交互效果。
交互效果:实现 hover 展示每组的同季度柱子
示例代码如下:
const rects = group
// ...
.on("mouseover", function (e) {
const target = d3.select(e.target);
const data = target.datum();
rects.filter((d) => d.label !== data.label).style("opacity", "0.2");
})
.on("mouseout", () => {
rects.style("fill", (d, i) => colors[i]).style("opacity", "1");
});
这里我们只要监听鼠标移入和移除的事件,然后通过 DOM 获取 D3 的选择集,接着通过 datum 获取对应的关联的源数据,最后过滤当前移入的柱子,将其他的颜色设置透明。
为了过渡自然,我们还要处理设置每个柱子的过渡效果,添加 transition 属性:
<style>
rect {
transition: all .2s linear;
}
</style>
最后调整后的效果:
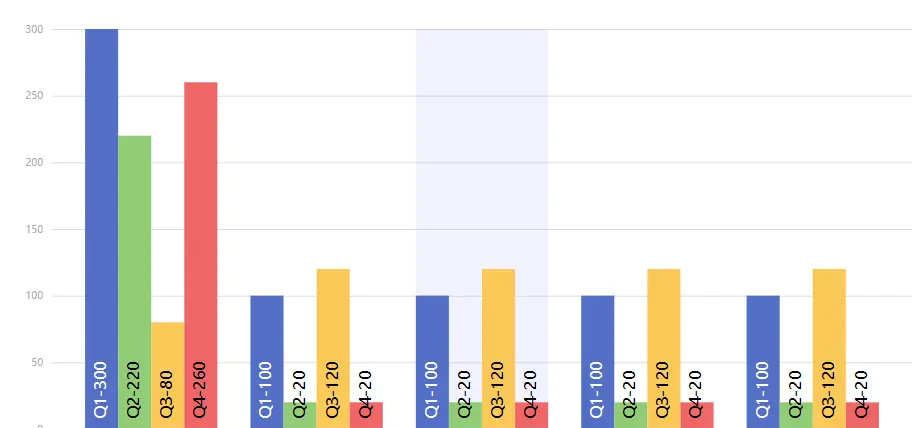
交互效果:实现整组的 hover
示例代码如下:
const groupItem = group
.append("rect")
.attr("x", (d) => columnWidth * ["Q1", "Q2", "Q3", "Q4"].indexOf(d.label))
.attr("y", 0)
.attr("width", xScale.bandwidth())
.attr("height", (d) => chartHeight)
.style("opacity", 0)
.on("mouseover", function (e) {
d3.select(this).style("fill", "blue").style("opacity", 0.05);
})
.on("mouseout", function (e) {
d3.select(this).style("fill", "blue").style("opacity", 0);
});
看下这次实现后的效果:
交互效果:显隐 tooltip
在做 tooltip 的 hover 的时候,我们需要在 SVG 的可绘制区域中监听鼠标的移入和移出,但是直接在 SVG 是无法获取数据值的,我们需要在组和柱子做监听,就可以获得数据值和坐标位置。这里先做个事件封装,在内部我们通过 g 容器,然后在里面存入所有 SVG 元素。
注意,浮层的阴影我们可以用 CSS 的 filter: drop-shadow , 文案的对齐我们使用 .attr("text-anchor", "end") 。
示例代码如下:
/**
* 监听浮层的位置
*/
function onGroupLabel(e, d) {
const mouseX = e.pageX;
const mouseY = e.pageY;
const labelOverlay = svg
.append("g")
.attr("class", "label-overlay")
.attr("transform", `translate(${mouseX}, ${mouseY})`);
labelOverlay
.append("rect")
.attr("x", 0)
.attr("y", 0)
.attr("rx", 5)
.attr("ry", 5)
.attr("width", 100)
.attr("height", 120)
.attr("fill", "#fff");
labelOverlay
.append("text")
.text(d.label)
.attr("x", 10)
.attr("y", 22)
.attr("fill", "#aaa");
const seasons = labelOverlay
.selectAll(".season")
.data(d.season)
.enter()
.append("g")
.attr("class", "season")
.attr("transform", (d, i) => `translate(10, ${35 + i * 20})`);
seasons
.append("circle")
.attr("cx", 5)
.attr("cy", 5)
.attr("r", 5)
.style("fill", (d, i) => colors[i]);
seasons
.append("text")
.text((d) => `${d.label}:`)
.attr("x", 15)
.attr("y", 9)
.attr("fill", "black")
.style("font-size", "12px");
seasons
.append("text")
.text((d) => `${d.value}`)
.attr("x", 75)
.attr("y", 9)
.attr("text-anchor", "end")
.attr("font-weight", "bold")
.attr("fill", "black")
.style("font-size", "12px");
svg.on("mousemove", function (e) {
labelOverlay.attr("transform", `translate(${e.pageX}, ${e.pageY})`);
});
}
/**
* 移除浮层的位置
*/
function removeGroupLabel(e) {
svg.selectAll(".label-overlay").remove();
svg.on("mousemove", null);
}
在对应的 SVG 元素做监听:
  // 柱子
// ...
.on("mouseover", function (e, d) {
rects.filter((d1) => d1.label !== d.label).style("opacity", "0.2");
onGroupLabel(e, d3.select(this.parentNode).datum());
})
.on("mouseout", () => {
rects.style("fill", (d, i) => colors[i]).style("opacity", "1");
removeGroupLabel();
})
// 分组
// ...
.on("mouseover", function (e, d) {
d3.select(this).style("fill", "blue").style("opacity", 0.05);
onGroupLabel(e, d);
})
.on("mouseout", function (e) {
d3.select(this).style("fill", "blue").style("opacity", 0);
removeGroupLabel(e);
});
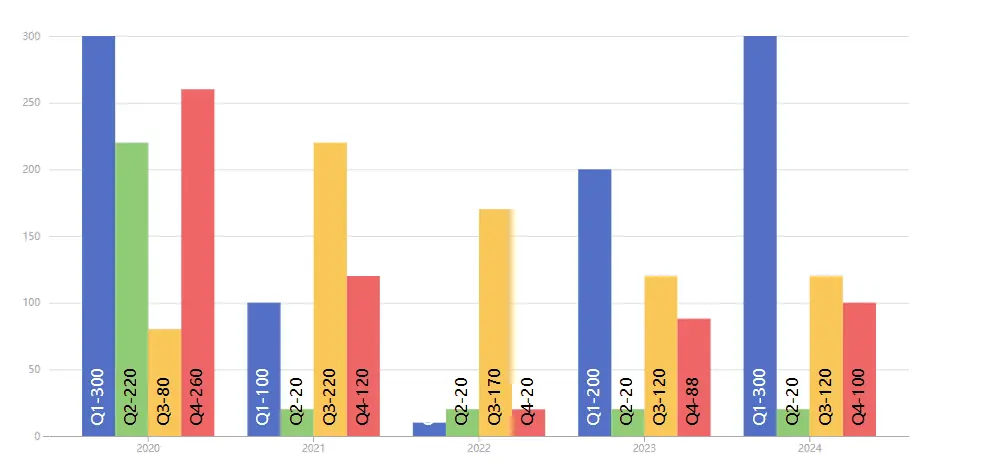
最终实现效果:
实现折线图
当我们有了柱状图的基础后,接下来我们再来实现折线图就简单很多了,这个时候我们能发现大量重复的代码,而绘制折线的核心代码只有一行:
// 1. 要绘制的数据
// 2. 定义画布大小和边距
// 3. 创建SVG元素
// 4. 定义比例尺
// 5. 定义和添加X轴和Y轴
// 6. 绘制折线图数据
svg.append("path").datum(data).attr("fill", "none").attr("stroke", "steelblue").attr("d", d3.line().x(d => x(d.x)).y(d => y(d.y)));
效果如下:

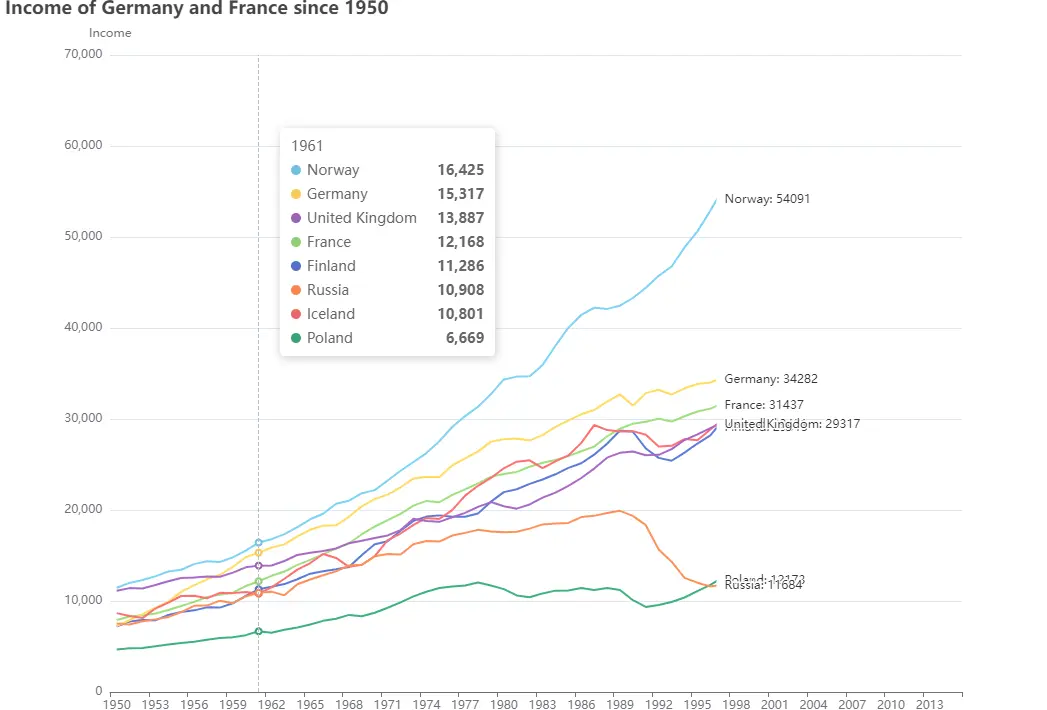
实现动态排序折线图
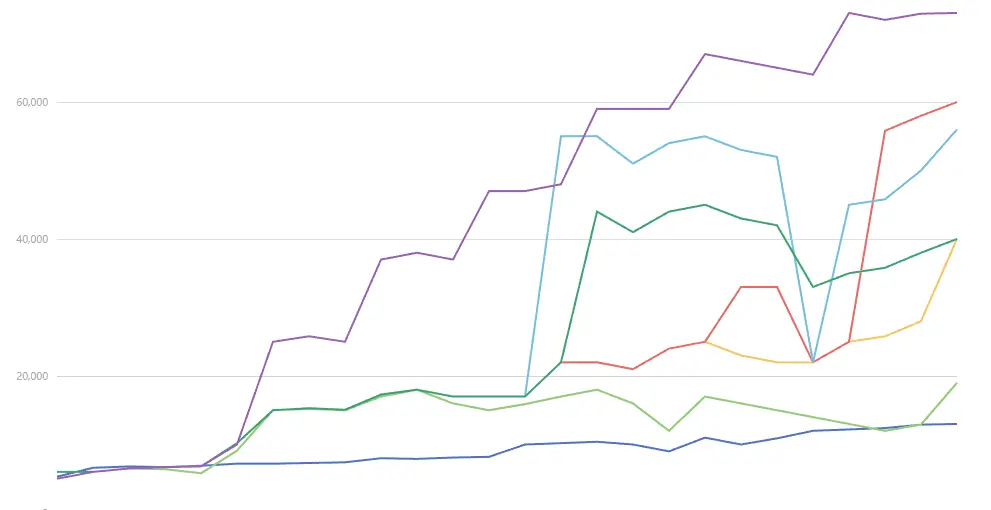
该图表难点在于动画递进效果、hover 展示效果,接下来我们就来实现这个 ECharts 中相对复杂的动态排序折线图。

前置工作
首先定义我们的数据集,为了方便维护,我们不会在 list 中定义大量的数组对象,因为这样意味着大量重复无用的属性,我们只需要用数组下标定位 date、color、label 的值。
定义数据集:
// 生成一些假数据
const data = {
list: [
[
5300, 6600, 6800, 6700, 6900, 7200, 7200, 7300, 7400, 8000, 7900, 8100,
8200, 10000, 10200, 10400, 10000, 9000, 11000, 10000, 10900, 12000, 12200,
12400, 12900, 13000,
],
[
5000, 6000, 6500, 6400, 5800, 9100, 15030, 15200, 15000, 17000, 18000,
16000, 15000, 15900, 17000, 18000, 16000, 12000, 17000, 16000, 15000,
14000, 13000, 12000, 12900, 19000,
],
[
5000, 6000, 6500, 6700, 6800, 10200, 15000, 15300, 15070, 17300, 18000,
17000, 17000, 17000, 22000, 22000, 21000, 24000, 25000, 23000, 22000,
22000, 25000, 25800, 28000, 40000,
],
[
6000, 6000, 6500, 6700, 6800, 10200, 15000, 15300, 15070, 17300, 18000,
17000, 17000, 17000, 22000, 22000, 21000, 24000, 25000, 33000, 33000,
22000, 25000, 55800, 58000, 60000,
],
[
6000, 6000, 6500, 6700, 6800, 10200, 15000, 15300, 15070, 17300, 18000,
17000, 17000, 17000, 55000, 55000, 51000, 54000, 55000, 53000, 52000,
22000, 45000, 45800, 50000, 56000,
],
[
6000, 6000, 6500, 6700, 6800, 10200, 15000, 15300, 15070, 17300, 18000,
17000, 17000, 17000, 22000, 44000, 41000, 44000, 45000, 43000, 42000,
33000, 35000, 35800, 38000, 40000,
],
[
5000, 6000, 6500, 6700, 6800, 10000, 25000, 25800, 25000, 37000, 38000,
37000, 47000, 47000, 48000, 59000, 59000, 59000, 67000, 66000, 65000,
64000, 73000, 72000, 72900, 73000,
],
],
date: [
"1910",
"1915",
"1920",
"1925",
"1930",
"1935",
"1940",
"1945",
"1950",
"1955",
"1960",
"1965",
"1970",
"1975",
"1980",
"1985",
"1990",
"1995",
"2000",
"2005",
"2010",
"2015",
"2020",
"2025",
"2030",
"2035",
],
color: [
"#5470C6",
"#91CC75",
"#fac858",
"#ee6666",
"#73c0de",
"#3ba272",
"#9a60b4",
],
label: ["Norwat", "France", "China", "Poland", "Russia", "Iceland", "US"],
};
然后定义我们的绘制区域、坐标轴以及样式的优化:
// 定义边距、宽高
const margin = { top: 50, right: 50, bottom: 50, left: 50 }
const width = 1000 - margin.left - margin.right
const height = 600 - margin.top - margin.bottom
// 将日期字符串转化为日期对象
const parseDate = d3.timeParse('%Y')
data.date = data.date.map(d => parseDate(d))
// 定义x轴比例尺
const x = d3.scaleTime()
.range([0, width])
.domain(d3.extent(data.date))
// 定义y轴比例尺
const y = d3.scaleLinear()
.range([height, 0])
.domain([0, d3.max(data.list.flat().map(d => d))])
// 在SVG中添加g元素并设置transform,来让g元素居中显示
const svg = d3.select('svg')
.attr('width', width + margin.left + margin.right)
.attr('height', height + margin.top + margin.bottom)
const g = svg.append('g')
.attr('transform', `translate(${margin.left},${margin.top})`)
// 添加x轴及其标签
g.append('g')
.call(d3.axisBottom(x))
.attr("class", "x-axis")
.style("color", '#aaa')
.attr('transform', `translate(0,${height})`)
// 添加y轴及其标签
g.append('g')
.attr("class", "y-axis")
.style("color", '#aaa')
.call(d3.axisLeft(y).ticks(5))
g.selectAll(".y-axis .tick line").filter((d, i) => i > 0).attr("x2", width).attr("stroke", "#aaa").attr("stroke-width", .4);
g.select(".y-axis path").style("display", "none");
接着我们需要绘制线段。
根据 data 生成path路径
在绘制每组时,我们 selectAll 就可以根据 data 传入的数组长度生成不同的分组,不用考虑数据的传入,这里的x(data.date[i]) 和 y(d) 分别代表了折线图中的每个数据点的横坐标和纵坐标。
由于 x 轴的比例尺定义了时间轴上的位置,所以根据每个数据点对应的时间,可以通过 x 比例尺来确定其横坐标。而 y 轴的比例尺定义了数据值的范围,所以根据每个数据点的数值,可以通过 y 比例尺来确定其纵坐标。
代码如下:
// 定义生成折线的函数
const lineGenerator = d3.line()
.x((d, i) => x(data.date[i]))
.y(d => y(d))
.defined(d => d !== null) // 防止缺少数据导致折线断裂
const group = g.selectAll('.group').data(data.list).enter().append('g').attr("class", "group")
const lines = group.append('path')
.datum(d => d)
.attr('class', 'line')
.attr('d', lineGenerator)
.attr('stroke', (d, i) => data.color[i])
.attr('stroke-width', '2')
.attr('fill', 'none')
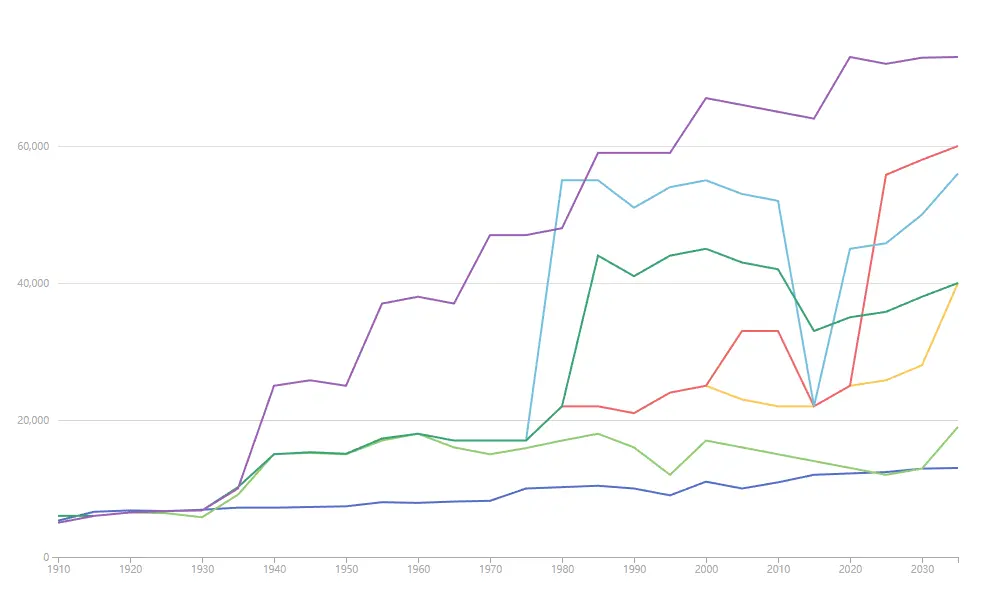
效果如下:
接着我们开始绘制折线图的动态效果:
// 绑定过渡方法和动画效果
lines.attr('stroke-dasharray', function () {
return `${this.getTotalLength()} ${this.getTotalLength()}`
})
.attr('stroke-dashoffset', function () {
return this.getTotalLength()
})
.transition()
.ease(d3.easeLinear) // 过渡效果
.delay(500)
.duration(1000)
.attr('stroke-dashoffset', 0)
stroke-dasharray 和 stroke-dashoffset 是 SVG 中用来定义路径线段样式的两个属性。
-
stroke-dasharray属性定义了对虚线的描述。例如,如果设置stroke-dasharray: 5 5,则表示在路径中每 5 个像素绘制一个实线,然后 5 个像素留空,然后再 5 个像素绘制一个实线……如此反复。 -
stroke-dashoffset属性定义了虚线的起始位置,也就是虚线距离路径起始点的偏移量。例如,如果设置stroke-dashoffset: 5,则表示路径虚线的起始点向路径起始点相对偏移 5 个像素。
在上面的代码中,首先通过获取 getTotalLength() 方法获取路径总长度,然后将 stroke-dasharray 属性设为该长度值的两倍,因此实现了完全隐藏路径线段的效果。接下来通过设置 stroke-dashoffset 的初始值为总长度值,实现了路径从一开始完全隐藏的效果。最后通过过渡效果和延迟设置,使得路径从隐藏状态逐渐展示出来,从而实现了路径动画效果。
效果如下:
最后,我们完善交互细节。
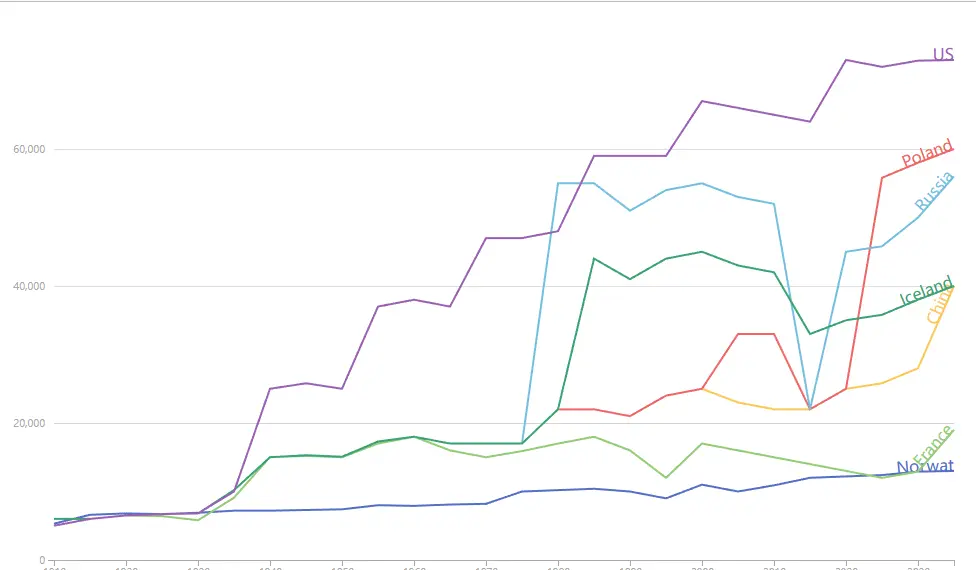
交互效果:文字跟随路径动画
首先创建了一个 textPath 元素,并将其添加到每个组中的 text 元素中。我们使用 xlink:href 属性将 textPath 元素与相应的折线路径进行关联,并使用 startOffset 属性设置文字的起始位置在线的端头右侧。然后,我们在动画过渡中,通过修改 startOffset 属性的值,将文字从线的端头右侧移动到线的起始位置,实现文字的展示效果。
代码如下:
// ...
const textPaths = group
.append("text")
.append("textPath")
.attr("xlink:href", (d, i) => `#line-path-${i}`)
.attr("startOffset", "100%")
.attr("text-anchor", "end")
.attr("fill", (d, i) => data.color[i])
.text((d, i) => data.label[i]);
// 绑定过渡方法和动画效果
lines
.attr("stroke-dasharray", function () {
return `${this.getTotalLength()} ${this.getTotalLength()}`;
})
.attr("stroke-dashoffset", function () {
return this.getTotalLength();
})
.transition()
.ease(d3.easeLinear) // 过渡效果
.delay(0)
.duration(6000)
.attr("stroke-dashoffset", 0);
textPaths
.attr("startOffset", "0%")
.attr("text-anchor", "end")
.transition()
.ease(d3.easeLinear)
.delay(0)
.duration(6000)
.attr("startOffset", "100%");
效果如下:
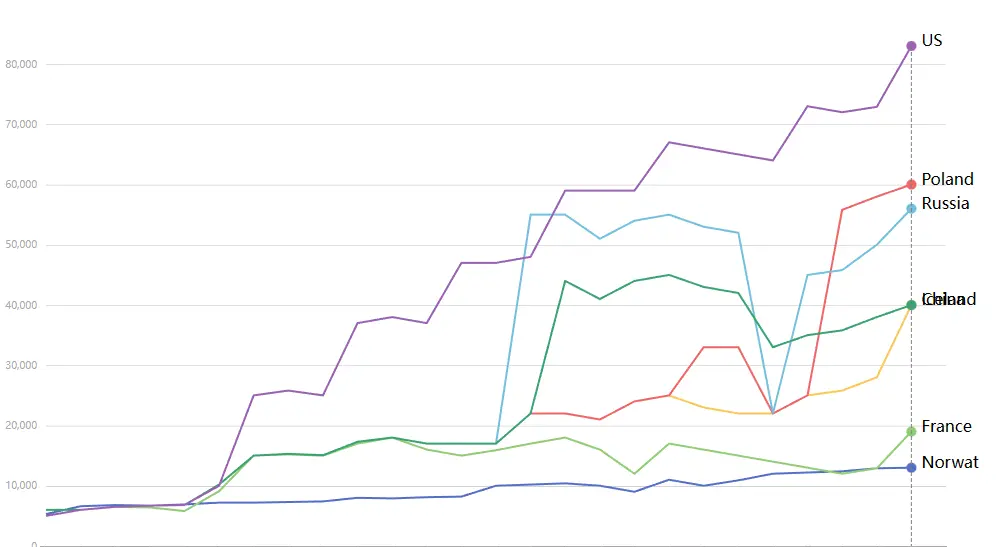
交互效果:插值计算文案位置
上文的文字跟随路径动画方法明显的缺陷就是文案是垂直于折线的,很显然不满足我们的需求,要想让文案在线端头的右侧移动,其实我们只要得到每个线的端头的 y 坐标即可。
我们获取 lines,并 each 遍历每个元素,筛选对应的 text,接着获取 dom 节点,通过 getTotalLength 能得到路径的长度。然后生成 interpolator, 用于创建一个在 0 和路径长度之间进行插值函数,用于动态计算路径上不同点的位置,从而实现路径绘制的动画效果。
实现思路我们有了,接下来我们只要监听line的tween方法的end事件,也就是能得到当前绘制的线的位置,位置范围是 0 到 1,而得到的 t 代表动画的进度,我们知道 interpolator 又是一个插值函数,那么对应能得到实际的长度了,然后通过 svg 的 getPointAtLength 就能获取对应的 point 坐标了。接下来修改下 text 节点的位置即可。
代码如下:
const texts = d3.selectAll(".a-txt"); // 选择所有文本元素
lines.each(function (d, i) {
const line = d3.select(this); // 当前折线元素
const text = texts.filter(function (_, j) {
return j === i; // 根据索引筛选对应的文本元素
});
const pathEl = line.node();  //获取dom节点
const pathLength = pathEl.getTotalLength();
const interpolator = d3.interpolate(0, pathLength);
line
.attr("stroke-dasharray", `${pathLength} ${pathLength}`)
.attr("stroke-dashoffset", pathLength)
.transition()
.ease(d3.easeLinear)
.delay(0)
.duration(6000)
.attr("stroke-dashoffset", 0)
.tween("end", function () {
return function (t) {
const length = interpolator(t);
const point = pathEl.getPointAtLength(length);
const x = point.x;
const y = point.y;
text
.text(data.label[i])
.attr("x", x + 10)
.attr("y", y); // 将位置应用到对应的文本元素
};
});
});
实现效果如下:
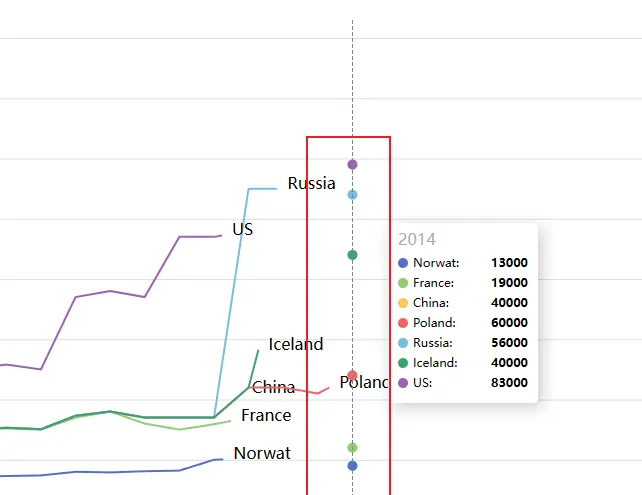
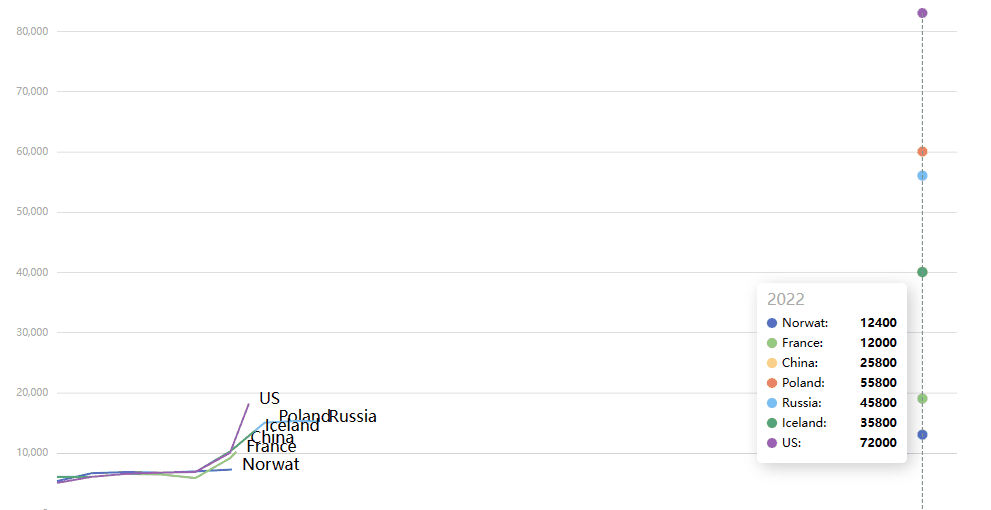
交互效果:辅助线、鼠标定位线的每个点并展示 Tooltip
我们在 SVG 监听鼠标移动的事件后,根据 mouseX 就可以得到索引的位置,通过这个索引我们可以获取到 data 里的任一数据,接着我们就可以绘制辅助线和浮层,而浮层的具体实现跟折线图类似,我们稍作修改即可。
绘制辅助线和浮层
代码如下:
svg
.on("mousemove", function (event) {
const mouseX = d3.pointer(event)[0];
const mouseY = d3.pointer(event)[1];
const year = new Date(x.invert(mouseX - margin.left)).getFullYear();
// 更新辅助虚线的位置和显示状态
if (year >= 1997 && year <= 2022) {
// 获取索引位置
let id = data.date.findIndex((item) => {
return new Date(item).getFullYear() === year;
});
helperLine
.attr("x1", x(data.date[id]))
.attr("y1", 0)
.attr("x2", x(data.date[id]))
.attr("y2", height)
.style("opacity", 1);
// 更新浮层位置
labelOverlay.attr(
"transform",
`translate(${mouseX > width - 150 ? width - 150 : mouseX + 10}, ${
mouseY > height - 180 ? height - 180 : mouseY + 10
})`
);
d3.select(".label-rect").style("display", "block");
d3.select(".over-year").text(year);
// 绘制label,和之前的折线图的label相似
initLabel(id);
}
})
绘制垂直辅助线 helperLine,我们只要 selectAll 和 join 创建元素后,由于是 group,我们在 data 的 d 中获取到的是 list 的某一项,这个时候传入索引我们就得到 y 轴的值。我们知道通过 y 轴比例尺和 y 轴的数据值,就可以通过 D3 的比例尺方法得到 y 轴的坐标值,而 mouseX 我们是知道的,所以接着我们就可以绘制相交点的圆形了。
绘制相交点圆形
const cs = group
.selectAll(".circle")
.data((d) => {
return [d[id]];
})
.join("circle")
.attr("class", "circle")
.attr("cx", (d, i) => x(data.date[id]))
.attr("cy", (d, i) => y(d))
.attr("r", 5);
let i = -1;
cs.each(function () {
const dom = d3.select(this);
i++;
dom.attr("fill", data.color[i]);
});
事件的优化
我们要注意这些 hover 的元素,在鼠标超出绘图区域,要通过 mouseout 移除浮层,但是在 svg 内部鼠标一旦移动到线段或文字等,也会触发 mouseout 就会误删。我们可以根据 class 类名做区分,但是后续新增 svg 节点后是很难维护的,所以是否移除辅助线、相交圆点、tooltip,我们通过鼠标是否超出绘图区域判断。
在进入 mousenter 的时候我们需要创建 svg 元素,在 mousemove 的时候我们要做更新节点的操作,在鼠标超出绘图区域的时候移除 hover 元素。
具体代码如下:
 .on("mouseenter", (e) => {
// 创建浮层元素
labelOverlay = svg.append("g").attr("class", "label-overlay");
// 绘制元素
labelOverlay
.append("rect")
.attr("class", "label-rect")
.attr("x", 0)
.attr("y", 0)
.attr("rx", 5)
.attr("ry", 5)
.attr("width", 150)
.attr("height", 180)
.style("display", "none")
.attr("fill", "#fff");
labelOverlay
.append("text")
.attr("class", "over-year")
.attr("x", 10)
.attr("y", 22)
.attr("fill", "#aaa");
})
.on("mouseout", function (e) {
const mouseX = e.pageX;
const mouseY = e.pageY;
const chartX = svg.node().getBoundingClientRect().x;
const chartY = svg.node().getBoundingClientRect().y;
const chartWidth = svg.node().getBoundingClientRect().width;
const chartHeight = svg.node().getBoundingClientRect().height;
if (
mouseX < chartX ||
mouseX > chartX + chartWidth ||
mouseY < chartY ||
mouseY > chartY + chartHeight
) {
svg.selectAll(".label-overlay").remove();
}
});
效果如下:
总结
最后,我们总结下这一节的关键知识点。
-
为什么要用 D3: D3 基于 SVG 的数据驱动视图的库,通过链式调用、封装比例尺、数学方法、数据状态的管理等,我们可以轻松绘制复杂的图表。
-
如何理解数据驱动视图: 我们的关注点只在数据,不用深入数据背后的调用,修改数据意味着视图会被更新。
-
如何实现柱状图: 定义绘图区域 -> scaleBand 用于离散数据,用在 x 轴的比例尺;在 y 轴我们用scaleLinear,生成比例尺 -> 生成坐标轴 -> 通过 rect 生成柱体。
-
实现多层级旋转标签柱状图的难点: 多层级我们要考虑好数据结构,也就是数组嵌套数组,在交互难点部分,通过在内部元素的 hover,传入 d、e,我们能创建 label,实际操作中我们很有可能遇到其他元素导致 mouseout,我们可以通过
dom.style("pointer-events", "none")或者监听元素位置判断是否选中来解决 label 的误删。是否高亮的实现我们只要在对应的元素监听事件即可。 -
如何实现折线图: 定义绘图区域 -> scaleTime 用于时间数据,用在 x 轴的比例尺;在 y 轴我们用 scaleLinear,生成比例尺 -> 生成坐标轴 -> 通过 path 生成折线。
-
实现动态排序折线图的难点:
- 线的动画实现:我们通过
stroke-dasharray来定义实线和虚线的长度,通过修改stroke-dashoffset来实现移动,同时应用 transition 过渡即可; - 实现文字跟随动画:我们只要监听 SVG 的 mouseX,通过插值转换器 interpolator,传入 tween 方法的 end 事件中回调的 t 得到对应的进度值,我们就可以得到实际线段的长度,最后通过 svg 的
getPointAtLength方法就可以得到 point 坐标,更新 text 的 x 和 y 的属性即可。
- 线的动画实现:我们通过
点击下方链接查阅掘金小册相关章节: 前端可视化入门与实战 – 谦宇 – 掘金小册 (juejin.cn)
原文链接:https://juejin.cn/post/7341408996598611987 作者:谦宇