今天带来三种多图共用图例的方法
第一种:单容器——使用dataset
dataset数据集是专门用于管理数据的组件。在echarts中,我们可以给系列单独赋值,也可以使用数据集进行统一管理。


配置如下
    var option = {
        legend: {},
        tooltip: {},
        dataset: {
            source: [
                ['product', '2012', '2013', '2014', '2015', '2016', '2017'],
                ['Milk Tea', 86.5, 92.1, 85.7, 83.1, 73.4, 55.1],
                ['Matcha Latte', 41.1, 30.4, 65.1, 53.3, 83.8, 98.7],
                ['Cheese Cocoa', 24.1, 67.2, 79.5, 86.4, 65.2, 82.5],
                ['Walnut Brownie', 55.2, 67.1, 69.2, 72.4, 53.9, 39.1]
            ]
        },
        series: [
            {
                type: 'pie',
                radius: '20%',
                center: ['25%', '30%']
                // No encode specified, by default, it is '2012'.
            },
            {
                type: 'pie',
                radius: '20%',
                center: ['75%', '30%'],
                encode: {
                    itemName: 'product',
                    value: '2013'
                }
            },
            {
                type: 'pie',
                radius: '20%',
                center: ['25%', '75%'],
                encode: {
                    itemName: 'product',
                    value: '2014'
                }
            },
            {
                type: 'pie',
                radius: '20%',
                center: ['75%', '75%'],
                encode: {
                    itemName: 'product',
                    value: '2015'
                }
            }
        ]
    };
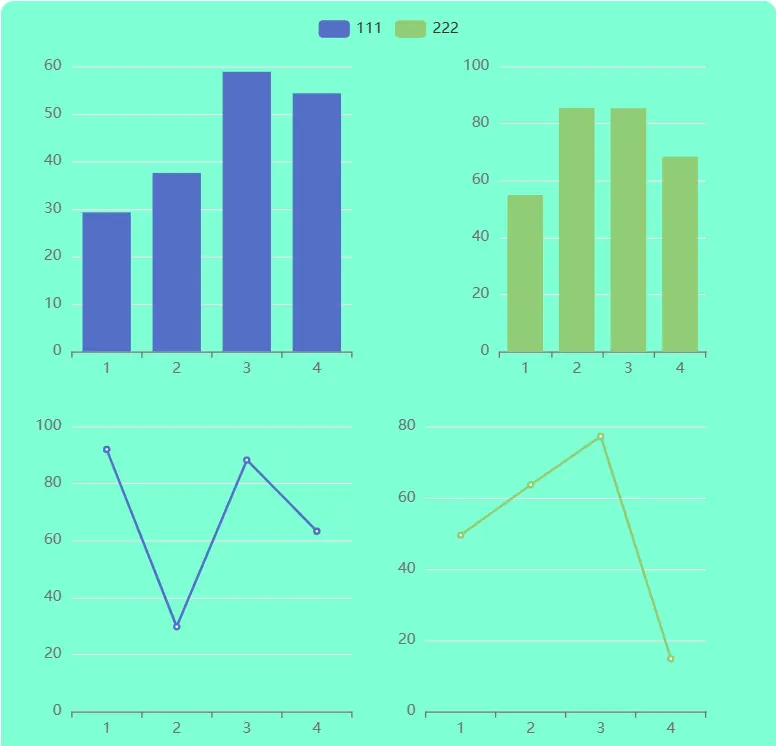
第二种:单容器——使用gridIndex、xAxisIndex和yAxisIndex
1、 设置多个grid以便图形可以分开展示
2、 为同属于一个图例的系列加上相同的name
最终得到结果如下
附代码
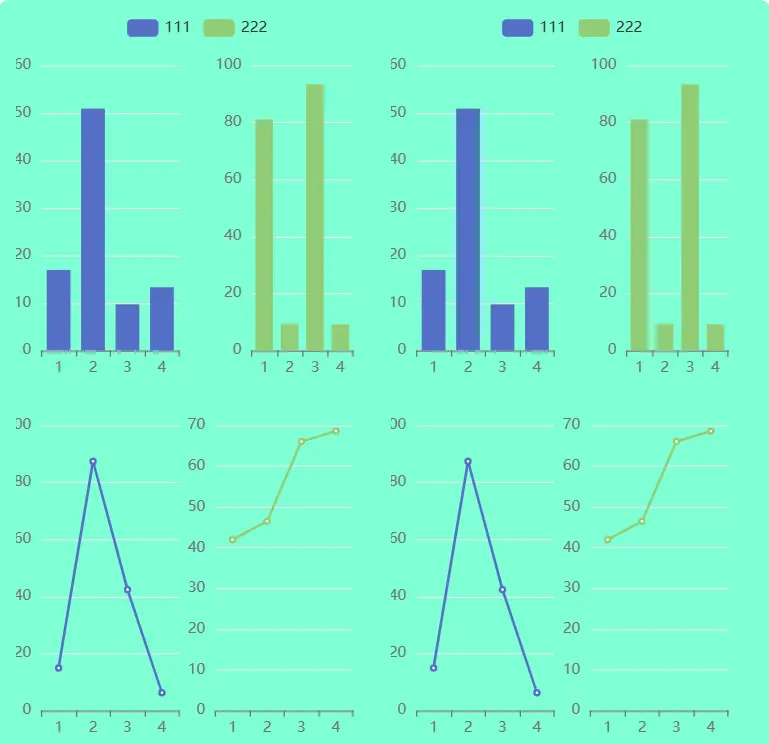
第三种:多容器——利用API,为legend绑定事件
- 首先必须了解知道,修改legend对象中的seleted属性可以改变图例选中状态
- 随后为其中一个容器绑定legend切换事件
legendselectchanged,在事件回调中手动修改另一个容器图例选中状态,即可同步操作
值得注意的是容器的echarts实例的渲染顺序,绑定事件的图表必须先渲染。并需要保证被修改图例状态的实例存在。
代码如下
    var e1 = echarts.init(document.querySelector('#e1'));
var e2 = echarts.init(document.querySelector('#e2'));
var option = {
grid: [
{ left: '7%', top: '7%', width: '38%', height: '38%' },
{ right: '7%', top: '7%', width: '28%', height: '38%' },
{ left: '7%', bottom: '7%', width: '38%', height: '38%' },
{ right: '7%', bottom: '7%', width: '38%', height: '38%' }
],
xAxis: [
{
type: 'category',
gridIndex: 0,
data: ['1', '2', '3', '4']
},
{
type: 'category',
gridIndex: 1,
data: ['1', '2', '3', '4']
},
{
type: 'category',
gridIndex: 2,
data: ['1', '2', '3', '4']
},
{
type: 'category',
gridIndex: 3,
data: ['1', '2', '3', '4']
}
],
yAxis: [
{
type: 'value',
gridIndex: 0,
},
{
type: 'value',
gridIndex: 1,
},
{
type: 'value',
gridIndex: 2,
},
{
type: 'value',
gridIndex: 3,
}
],
legend: {},
tooltip: {},
series: [
{
type: 'bar',
name: '111',
yAxisIndex: 0,
xAxisIndex: 0,
data: new Array(4).fill(0).map(() => (Math.random() * 100).toFixed(2)),
},
{
type: 'bar',
name: '222',
data: new Array(4).fill(0).map(() => (Math.random() * 100).toFixed(2)),
yAxisIndex: 1,
xAxisIndex: 1,
},
{
type: 'line',
name: '111',
yAxisIndex: 2,
xAxisIndex: 2,
data: new Array(4).fill(0).map(() => (Math.random() * 100).toFixed(2)),
},
{
type: 'line',
name: '222',
yAxisIndex: 3,
xAxisIndex: 3,
data: new Array(4).fill(0).map(() => (Math.random() * 100).toFixed(2)),
}
]
};
e1.setOption(option);
e2.setOption(option);
e1.off().on('legendselectchanged', function (params) {
var tempOption = {
legend: {
selected: params.selected
}
}
e2.setOption(tempOption)
});
总结
前两种情况可以覆盖大部分场景,但对于数据的处理比较繁琐,必须搞明白数据与坐标系之间的对应关系。最后一个方法也有不足之处,虽然一劳永逸,但与执行顺序和实例自身状态关联较深。可根据需要选择最佳方式~
原文链接:https://juejin.cn/post/7355723609371836442 作者:用户5603704287125